In the midst of an acute labor shortage that has pushed wages to new highs, a few legislators have opted to introduce another bill to raise New Hampshire’s minimum wage. 

House Bill 57 would raise the minimum wage to $15 an hour by 2025, then tie it to the inflation rate, ensuring regular, automatic increases. 

New Hampshire has about 48,000 job openings, according to U.S. Bureau of Labor Statistics data, and only about 20,000 unemployed persons. 

This imbalance between job openings and available labor has persisted for years. And that has driven wages in New Hampshire higher. New Hampshire Employment Security put the mean average wage at $30.12 an hour in last year’s report (based on 2021 data). In 2019, it was $25.94. 

The average entry-level wage in the 2022 report was $14.36, up from $11.80 in 2019. 

Competitive pressure is pushing wages up to the point that dishwashers have moved out of the list of the 10 lowest-paid occupations in the state. The lowest average wage in the 2022 report belonged to gambling dealers, at $11.59 an hour. Food preparation workers were above that at $12,10 an hour. 

With a booming economy and a severe labor shortage combining to raise wages naturally, the market is already moving compensation in low-paying occupations toward the $15 an hour goal. House Bill 57 would mandate a $13.50 minimum wage by this September. Fast food restaurants regularly advertise jobs well above that rate now, and food prep workers on average are quickly approaching that level. 

Into this discussion, researchers last month dropped yet another study showing that minimum wage increases have costs that can make people who work in the lowest-paid occupations worse off. 

Researchers at the John Hopkins Bloomberg School of Public Health and the University of Minnesota-Twin Cities School of Public Health found that minimum wage increases reduced the number of employers who offered health insurance. 

“We find that a $1 increase in minimum wages is associated with a 0.90 percentage point (p.p.) decrease in the percentage of employers offering health insurance, largely driven by small employers and employers with more low-wage employees. A $1 increase is also associated with a 1.80 p.p. increase in the prevalence of plans with a deductible and three percent increase in average deductibles.”

Though minimum wage hikes led to reductions in employer-sponsored health insurance, they did not lead to increases in uninsured rates, the authors found. That is “likely explained by an increase in Medicaid enrollment,” they wrote.

This study comes on top of decades’ worth of research that, on the whole, tends to find a negative effect on employment — particularly for younger workers and those with less education — from minimum wage increases. 

The preponderance of research on minimum wage increases shows that government-mandated compensation increases are not cost-free. Forcing employers to raise wages in ways that are unrelated to productivity tends to result in shifting resources from other parts of the business. That can include eliminating hours, positions or benefits.

Advocates for high minimum wages seem to assume that employers, including small businesses, simply have troves of cash reserves lying around and pay what they do out of stinginess. But employers generally aren’t sitting on piles of treasure like Smaug in his cave under Lonely Mountain.

And employers can’t simply manufacture more money whenever they want to spend more. Only the government can do that. Employers have to make trade-offs. If the government makes them pay more for low-skilled labor, they’ll take that money from somewhere else. And the results won’t necessarily be net positive for the low-skilled workers legislators intended to help. Usually, the opposite is true. 

New Hampshire’s view of national politics is distorted by the presidential primary. The distortion is so strong that sometimes we fail to see broader national trends until they become part of a narrower story about presidential ambitions.

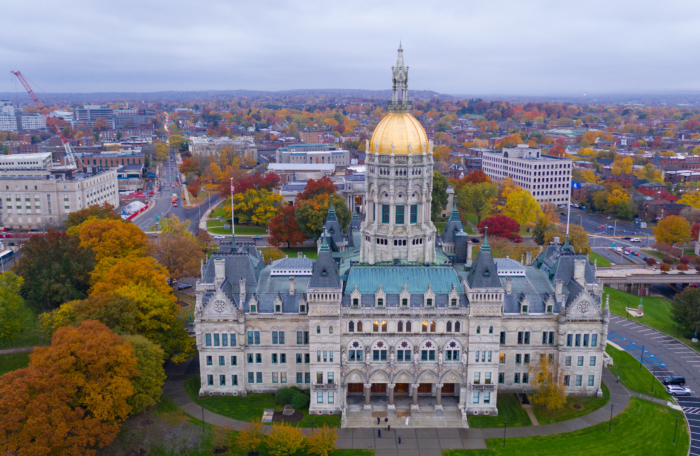
Gov. Chris Sununu’s 2023 inaugural address is a perfect example. The speech stands on its own as a statement of what we might call New Hampshire exceptionalism.

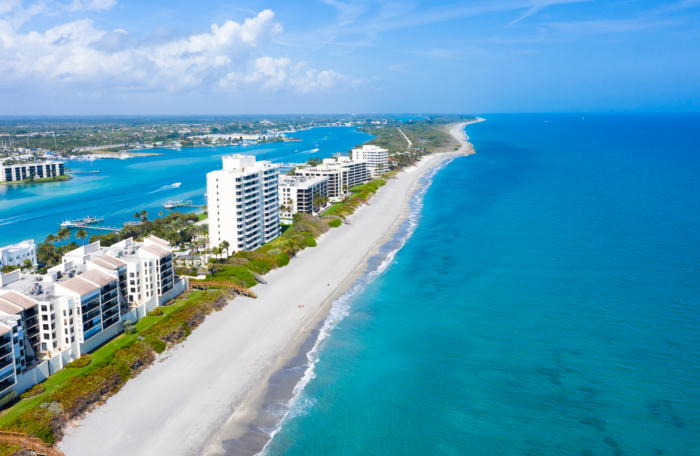
“Over the last six years, New Hampshire has become an island of freedom surrounded by highly taxed, highly regulated states.

“We are a harbor for citizens fleeing the states they once called home in pursuit of our Live Free or Die way of life.

“We continue to open up doors of opportunity, giving families the freedom to choose the path that best suits their needs.

“We have provided leadership that puts ‘The Individual’ ahead of ‘The System.’ Ensuring that everyone — regardless of income, gender, race, or religion – has the same opportunities to succeed.”

The speech drew immediate comparisons with Florida Gov. Ron DeSantis’ 2023 inaugural address, delivered two days before.

Both governors cited studies that rated their states high in measures of economic and personal freedom, and quality of life. Both portrayed their states as refuges for free people fleeing the grip of heavy-handed government in neighboring provinces.

DeSantis and Sununu are being discussed as potential rivals for the 2024 Republican presidential nomination. So the similarities in their speeches were taken by many as evidence of their ambitions.

There’s obvious merit to such observations. And yet presidential ambition can’t entirely explain these speeches. Something larger — and more important — is at work here.

Governors listing their state’s accolades is nothing new. Maggie Hassan touted New Hampshire’s national rankings in her 2013 inaugural address. What’s most noteworthy this year is how similar Florida’s and New Hampshire’s ratings are.

As we’ve written before, Florida and New Hampshire have become rivals for the top spot in the Fraser Institute’s Economic Freedom in North America report. (In 2021, New Hampshire ranked No. 1, Florida No. 2. They switched places in 2022.)

That’s not an accident. Florida’s elected officials have spent many years striving to improve their state’s economic position relative to rivals such as New Hampshire, Texas, Tennessee and North Carolina.

This is how Rick Scott began his inaugural address in 2011:

“We gather today to talk about Florida’s future.

“To assess where we are . . .

“To define where we want to go . . .

“And to plan how to get there.

“Clear goals and hard work can achieve amazing things.

“The giant oak trees that surround us here

“ARE what they ARE

“Because acorns had a plan.

“Once we take the right steps, I am absolutely convinced that Florida will become the most exciting place in the world to live and work.

“Let’s begin by facing squarely the challenge of our time-a stalled economy.”

Scott said moments later, “job creation is a MISSION.”

He proposed to cut taxes and regulations, reform the bureaucracy, and expand educational opportunities.

Four years later, in his 2015 inaugural address, he touted the 700,000 jobs Floridians had created.

National rankings of the kind Sununu and DeSantis cited are metrics by which governors increasingly finding themselves measured — by themselves, their rivals and voters.

It’s difficult to say how much these rankings guide governors and legislators. As college rankings have been shown to influence university administrations, it’s likely that these now constant state rankings do help to shape policy.

And they appear to be focusing state leaders on policies that stimulate economic growth, and for good reason. Policies that lead to growth lead to better economic and social outcomes, which then lead to higher rankings.

Economic growth creates jobs, raises incomes and improves health and well-being. As Veronique de Rugy wrote last week:

The economy grew at an average of 3.5% between 1950 and 2000. Since 2000, that rate has slowed to 1.7%. The cost of lower growth is real. John Cochrane does the math for us: “If the U.S. economy had grown at 2% rather than 3.5% since 1950, income per person by 2000 would have been $23,000 not $50,000.”

What policy other than economic growth has the power to double the average American’s living standard in a generation? None. And here’s the cherry on top: All the stuff an advocate anywhere on the political spectrum claims to value—good health, clean environment, safety, families and quality of life—depends on higher growth.

Faster economic growth is likely to engender even greater benefits for the bottom 50% of the income distribution, which contains young people just starting their careers, retirees trying to stretch their fixed incomes with part-time work, and those populations that are caught in intergenerational cycles of poverty. And this is true everywhere in the world. As Harvard University’s Dani Rodrik rightly sums up, “Historically nothing has worked better than economic growth in enabling societies to improve the life chances of their members, including those at the very bottom.”

Governors have caught on. Because they want to end their terms with wealthier, happier people, they’ve become more aggressive in their pursuit of growth-focused economic policies.

In his 2015 inaugural address, Arkansas Gov. Asa Hutchinson proposed cutting taxes and improving public education to “compete and win in this global marketplace.”

In his 2021 State of the State address, Texas Gov. Greg Abbott boasted of his state’s top national rankings and said the government had a duty to “keep Texas the freedom capital of America.”

Even governors of states that are losing population and businesses are finding ways to claim the title of most free state. California Gov. Gavin Newsom last week claimed his was the “true freedom state.”

In some states, legislators are leading the way. Last year, North Carolina celebrated its CNBC ranking as “America’s top state for business” after a decade-long push to reform the tax code helped create “the nation’s strongest economy.”

The big story here is not the 2024 presidential primary. It’s that state-level elected officials, particularly governors, are thinking an acting as if they’re engaged in a national competition to achieve the greatest economic, educational and social welfare gains for their populations.

They’re pursuing not just results, but results that can be measured.

In that pursuit, they’ve learned that creating a climate conducive to economic growth produces the best results.

New Hampshire learned this decades ago. Our growth-based policies created the New Hampshire Advantage, which made us the economic marvel of New England.

Now that so many others have caught on, New Hampshire can’t afford to slack off. Being an island of liberty in the Northeast has dramatically improved our quality of life here. But the field of competition has expanded well beyond New England.

States all over the country are working every day to lure our young people and poach our businesses. If we stop pushing for competitive advantages by keeping taxes low, improving educational opportunities, budgeting more efficiently, and removing barriers to entrepreneurship and economic opportunity, we risk undoing the massive gains we’ve made since the middle of the last century.

It’s a mistake to view the Sununu and DeSantis inaugural addresses purely through the lens of the presidential primary.

These governors have become part of the presidential conversation because of their policy successes. And those successes are rooted in an older, ongoing competition among many states (often led by governors) to improve measurable outcomes for their residents.

That ongoing, and progressively more intense, competition is the bigger story.

The legend of Santa Claus is based on the actual St. Nicholas, and all tales of jolly old St. Nick share the same beginning. 

Nicholas, born in 280 AD, was orphaned when his parents died in an epidemic. He went to live with his uncle, a Christian bishop. Strong in his faith, the young Nicholas chose to devote his life to serving others. In pursuit of this mission he began giving away his family fortune.

Wait, his what?

Nicholas’ parents were, depending on the version of the story, either wealthy or at least very prosperous. When they died, the boy is said to have inherited quite a lot of money. 

Somehow, this detail often gets left out of the Santa story. Think of all the Christmas stories you’ve heard. How many times have they mentioned that Santa was rich?

Our tradition of hanging stockings at Christmas is rooted in the legend of St. Nicholas tossing three bags (or balls) of gold through the window of a poor man’s house to provide a dowry for each of the man’s three daughters. The gold is supposed to have landed in the girls’ shoes or their stockings that were hanging by the fireplace to dry. Nicholas perpetrated this good deed at night in obedience to Matthew 6:1, which warns against performing works of charity in front of others. 

Nicholas’ charity became the stuff of legend, and tales spread of a saint who gave money to the poor and helped children (even bringing some back to life through prayer). 

All of this was miraculous in the third century. Today, bringing people back to life through prayer is still miraculous. But people giving away enormous sums of money happens every day and we don’t consider it remarkable at all.

In the centuries since St. Nicholas tossed his inherited gold through the poor man’s window, economic growth has created millions of Santas. And we can create more. 

An obvious but overlooked lesson in the Santa Claus story is that the one necessary precondition for the existence of Santa Claus is wealth. 

Had Nicholas been poor, he’d have had no gold to give away. 

(Yes, Santa’s got a brand new bag, and it’s full of money.) 

When you think about it, having more than you need for survival is the foundation of all charity. And so the key to stimulating more charitable giving is to create more wealth. 

Research on charitable giving bears this out. When the economy grows, charitable giving increases. When it shrinks, charitable giving also shrinks.  

In 2021, Americans gave away $484.5 billion. And that’s just in official donations that can be tabulated. It’s doubtful that St. Nicholas could’ve comprehended a sum so large. 

But there’s another, even greater, benefit of economic growth. It reduces the need for charity in the first place. 

This chart of global hunger vs. GDP per capita shows how economic growth feeds the poor.

This chart of child mortality by level of prosperity shows how economic growth saves children’s lives. 

This chart of world GDP during the last two millennia shows the power of growth to lift people out of poverty.

Simply put, economic growth has created millions of Santas who give away billions of dollars a year. And the economy itself has become a sort of super Santa, enriching humanity and keeping children alive on a scale that St. Nicholas would envy. 

In “A Christmas Carol,” why isn’t Scrooge poor? Because a poor Scrooge could do nothing for Bob Cratchit and Tiny Tim. The spirits save Scrooge’s soul, but Scrooge’s wealth saves Tiny Tim’s life.

The stories of St. Nicholas and Scrooge both focus on their hearts. Their desire to help others is central to their transformation into folk heroes. But their charitable acts are made possible by their wealth.

The best way to spread Christmas cheer might well be singing loud for all to hear. But the best way to spread Christmas giving is to make everyone prosperous.

In the opening of “The Muppets Christmas Carol,” Gonzo and Rizzo the Rat are selling apples in a dingy London market. Gonzo scolds Rizzo for eating the inventory. 

“Hey, I’m creatin’ scarcity,” Rizzo replies. “Drives the prices up.”

Rizzo is a clever rat.

Later in the movie, the ghosts of the Marleys tell Scrooge how they enjoyed overcharging the poor for rent. (In the Muppets version, there are two Marleys.)

Rizzo didn’t comment on those lines, but he might’ve dead-panned, “maybe someone ate the apartments and drove up prices?”

As Dickens’ classic tale is retold and rewatched this Christmas season, many Granite Staters face a harsh reality that Rizzo — and Scrooge — would understand. Scarcity keeps driving up prices for homes and apartments. 

You don’t need to be visited by the ghosts of housing markets past to see the problem — and why Scrooge would love it. You just have to compare the markets for short-term and long-term rentals.

Demand for short-term rentals has surged nationwide. The number of nights booked in short-term rentals rose 15.8% from October of 2021 to October of 2022, The Wall Street Journal reported last week. 

Investors in short-term rental properties expected prices to rise along with demand. But something happened on the way to sipping daiquiris on the beach as the rent money poured in. A lot of other people responded to the high rates by offering their properties for rent too.

“However, while the absolute number of bookings has risen, there has also been a sharp rise in supply of available short-term rental listings in the U.S., up 23.3% in October 2022 compared with October 2021,” the Journal reported. 

A woman who rents her California home on Airbnb told the Journal, “I’ve felt a massive drop” in rents she can charge. A holiday weekend at her home fell from more than $1,000 per night during the pandemic to around $275 now. Why such a collapse? Demand rose, which drove up prices, and those higher prices prompted investors to increase supply, which brought prices back down. That’s how a market would normally function. 

But it’s not how the market for long-term rentals works. 

In October, median rents were up nationwide by 7.8 percentage points, year over year, according to rent.com. In New Hampshire, the median rent was up 14.12%, by the website’s measure. 

Would-be home-buyers have experienced similar price increases. The median single-family existing-home price was up 8.6% in the third quarter, according to realtor.com. The Union Leader reported Tuesday that the median single-family home price in New Hampshire rose by $34,000 from last November to this November. It’s now $435,000.

For homes, apartments and short-term rentals, demand remains strong. But prices have fallen in only one of those markets: the one where supply faces the fewest constraints.  

“My reaction is that the growth in short-term rentals has come about because people are converting their own homes, or parts of them, into short-term rentals,” said Jason Sorens, director of the Center for Ethics in Society at St. Anselm College and author of the Josiah Bartlett Center’s 2021 housing report. “Rarely do people build units specifically for short-term rental. And that’s where the real housing supply bottleneck is: it’s become harder to build. Without more building, we aren’t going to see a similar supply increase for long-term rentals. But the other point this news shows us is that if we did increase supply, it would reduce rents.”

As we documented last year, overly restrictive local regulations are a significant barrier to new development in New Hampshire. These regulations make it difficult to build new housing, which prevents developers from meeting demand. That creates scarcity, which drives up prices. Rizzo would be proud. 

And Scrooge would be thrilled. Scrooge, don’t forget, was a landlord as well as a money lender. He could get away with charging outrageous rents for decades only if his renters had no cheaper options. So Scrooge would be no fan of loosening land use regulations to allow more apartment and home construction.

If Granite Staters want to avoid turning our existing housing shortage into a Dickensian nightmare, the only solution is to loosen the restrictions and let developers create more supply.   

Newly elected lawmakers meet Wednesday to elect officers for the legislative session that starts in January. The House is divided 201-198, with one seat open, as the race ended in a tie. With such a narrow majority, leadership votes could get contentious quickly, and the opportunity for drama is higher than usual. 

How dramatic could things get? It turns out that we have some precedent to look to for answers. And we looked at it. And, well, the words “uh-oh” come to mind. 

Only once in New Hampshire history has the House of Representatives been more closely divided than it is for the 2023 session. That was in 1871, a time not renowned for its civility.

Just six years after the Civil War ended, New Hampshire elected a legislature evenly divided between Democrats and Republicans. The Senate consisted of six Democrats and six Republicans; the House sat 165 Democrats and 164 Republicans.  

When the House session opened on June 7, the stakes were not just high, they could hardly have been higher. Not only was House leadership up for grabs, but two Senate seats were unfilled, and filling them fell to the House. Oh, and the governor’s race that year also fell to the House. Control of the entire state government was on the line.  

That was the situation when members gathered in the morning to elect officers. Election of a speaker was the top order of business, and it was conducted without a fight. On the first ballot, Rep. William Gove of Weare was elected speaker 164-162. 

Rep. Gove was escorted to the chair by two members, whereupon he addressed the divided body as “gentlemen” and delivered a short and conciliatory speech. 

“It may not, perhaps, be amiss for me to express the hope that we shall approach the duties and responsibilities of this session with that careful deliberation and earnest forethought which are so necessary to wise and impartial legislation,” he said. 

And so the members of the House did proceed with careful deliberation and earnest forethought to deploy the diligently memorized rules, norms and customs of the people’s House in service of the most public-spirited effort to effect the destruction of their political opponents.  

The first order of business after choosing a speaker was to elect the House clerk and assistant clerk. This simple task took the next two days. In the process, names were struck from motions, the speaker was challenged, votes miraculously changed overnight, and members tried to pass resolutions to expel their colleagues.  

The initial motion to elect James Jackson of Littleton as clerk and James Colbath of Barnstead as assistant clerk was hit immediately with an amendment to scratch the names and “proceed by ballot to the choice of a Clerk.” The vote on the amendment was 160-159, so Speaker Gove had to cast his first vote to create a tie. The partisan maneuvering had begun. 

An attempt to replace the clerk slate with two other names was killed 161-162, and it was followed by a motion to adjourn, which also failed, followed by a motion to table, which also failed. Then a member questioned the legality of the original motion, asserting that a special rule was needed.

Speaker Gove ruled that a special rule was not needed. In the ensuing series of votes, a motion to uphold his ruling failed 162-164. This was quickly followed by a vote to adjourn, which passed.

When Day 2 of the session opened at 10 a.m. on Thursday and a prayer was said, a member moved to draw seats, and another member moved to declare the drawing of seats null and void. Things went downhill from there.

A motion to adjourn until the next day was defeated, followed by a motion to lay the drawing of seats on the table, which was also defeated. Unable or unwilling to get anything else done, the House then adjourned until 3 p.m.

Upon returning, representatives drew their seats, then sustained the speaker’s ruling from the previous day. How? The majority claimed to have discovered overnight that the previous day’s 162-164 vote against the speaker’s ruling was in fact a 162-154 vote to sustain the speaker’s ruling. 

The question was then moved to vote by ballot on the clerk and assistant clerk. The speaker ruled the motion out of order and refused to hear an appeal. A member from Somersworth asked to be excused from the voting but the speaker would not excuse him. A vote on whether to put the main question (of electing a clerk) was moved, and the vote was 163-163. The speaker broke the tie. 

Then the gloves came off.

A member rose to offer a resolution to expel another member from the House on the grounds that he hadn’t lived in the state for at least two years, as required by the state constitution. The speaker ruled the resolution out of order. A motion to adjourn was made, but failed to pass. 

Finally, the first half of the original motion, to elect Jackson as clerk, was brought to the floor and passed 164-162. A motion to adjourn was offered, ruled out of order, and the vote for Colbath as assistant speaker followed and was passed 163-162. The House adjourned, having accomplished the election of its three key officers over two days.

The representatives had obviously ignored Speaker Gove’s request in his acceptance speech that members conduct their business “with as little consumption of time as is consistent with due diligence and careful consideration.”

On Friday, June 9, the House reconvened, and members from both sides began bombarding the speaker with resolutions to expel other members for not being qualified to serve. A member from Milford was called to order for violating House rules by stating that Democrats had behaved poorly in former years and he was “going to give them some of their own medicine.”

On Saturday, members elected two senators and Democrat James Weston of Manchester (namesake of Weston Observatory, and pictured above) as governor.

With a one-seat House majority, Democrats managed to get their governor and a Democratic president of the evenly divided Senate. The hard-fought victories lasted only for that session, though.

The next year, voters elected a Republican governor, an 8-4 Republican Senate, and a 210-150 Republican House. Which could be a good reminder that, in politics, victories — and losses — are not always as high-stakes as they often feel.

(Editor’s note: The House records from back then are not as orderly as they are today. If any reader finds a minor error in the narrative of these votes, please let us know and we’d be happy to correct it.)

As Americans and Granite Staters, we have so much to be thankful for that keeping track of it all can be difficult. Where does one begin? 

Family and friends, health and happiness, clean air and water, mountains and maple syrup, having a buffer of at least three states between us and New Jersey. 

Gratitude often comes from perspective. Surviving documents from the settlers who enjoyed the first Thanksgiving in Massachusetts Bay offer a great dose of it. 

Edward Winslow wrote that the men went hunting and fowling, bringing back “as much fowle, as with a little helpe beside, served the company almost a weeke,” and that natives presented five deer to the company for the feast. 

“And although it be not always so plentifull, as it was at this time with us, yet by the goodness of God, we are so farre from want, that we often wish you partakers of our plentie,” he wrote.

The food was so plentiful that year that it inspired settlers to send home letters so unbelievable that Gov. William Bradford felt the need to remark that they “were not fained, but true reports.” The food was all gathered, hunted or fished. There was no Market Basket; the Demoulas family hadn’t arrived yet. 

Here’s your perspective: Imagine living in a world in which enduring the hardships of a colonial settler’s life improved your living standards.

For the Pilgrims, living in the undeveloped Massachusetts frontier was an economic step up. Their idea of abundance was a good harvest (provided by providence) and enough wild game to live on for a week. Even with help from the native inhabitants, the first settlers struggled to produce a subsistence-level supply of food.

Before the Enlightenment unleashed the flood of human ingenuity that created modernity, life was like that for pretty much everyone.

As Enlightenment ideas eroded rigid social hierarchies and unleashed the brainpower of the lower classes (and created a large middle class), an explosion of innovation led to historically unprecedented gains in food productivity.

In 1600, 20 years before the Mayflower landed, the United Kingdom produced enough food to supply its population with 1,877 calories per person per day, according to the data website Our World In Data. That figure was 1,381 in the year 1,300. So over nearly 300 years, the UK gained about 500 calories per person per day.

By 1700, the UK produced 2,229 calories per person per day, for an increase of 352 calories in just 100 years, a huge improvement. 

But in the next 318 years, the UK’s food productivity exploded. By 2018, the country produced a 3,344 calories per person per day, a stunning 50% increase in just over 300 years. 

The United States produced 2,952 calories per person per day in 1800, the year Thomas Jefferson beat John Adams for the presidency. That was about 500 more than the UK, 700 more than Germany and 1,100 more than France. And the industrial revolution hadn’t taken off yet. 

By 2018, the United States was producing a world-leading 3,782 calories per person per day. 

“Almost all that ordinary people used and consumed in the 17th century would have been very familiar to people living a thousand or even a couple of thousand years earlier,” Max Roser explains. “Average incomes (as measured by GDP per capita) in England between the year 1270 and 1650 were £1,051 when measured in today’s prices.”

Then came the Enlightenment, and the great enrichment that followed. 

As Roser puts it, “an average person in the UK today has a higher income in two weeks than an average person in the past had in an entire year. Since the total sum of incomes is the total sum of production this also means that the production of the average person in two weeks today is equivalent to the production of the average person in an entire year in the past. There is just one truly important event in the economic history of the world, the onset of economic growth. This is the one transformation that changed everything.”

This is why the Josiah Bartlett Center for Public Policy puts such a high priority on economic growth. Without it, the world as we know it would not exist. Neglect or smother it, and our descendants will live worse, not better, lives than we do. 

Freedom creates opportunity, which creates abundance, which leads to statistics like this: In the United States today, there are two job openings for every unemployed person. In New Hampshire, there are three job openings for every unemployed person. 

Four hundred years ago, we were in a desperate, daily search for enough calories to survive the next few days. Now, we’re in a desperate, daily search for ways to convince people to stop eating so much.

In the United States, and much of the rest of the world today, prosperity and abundance are so common that they’ve become the default expectation for the vast majority of the population. For that, we will be forever grateful. 

New Hampshire has lost its title as the most economically free state in the union. The top spot this year goes to Florida, by a hair, according to the 2022 Economic Freedom of North America report released today by the Fraser Institute, an independent, non-partisan Canadian public policy think-tank.

Florida scored 7.94 out of 10 in this year’s report (up from 7.78 last year), beating out second-place New Hampshire (7.84).

Economic freedom—the ability of individuals to make their own economic decisions about what to buy, where to work and whether to start a business—is fundamental to prosperity.

“As we’ve pointed out for years, Florida, Tennessee, Texas and other states are serious about gaining a competitive advantage over New Hampshire,” said Andrew Cline, president of the Josiah Bartlett Center for Public Policy. “If we want to have a New Hampshire Advantage 20 years from now, we have to stay focused on expanding economic freedom for all Granite Staters. If we rest on our past accomplishments, we will be left behind.”

Enhancing government control over individuals’ economic choices takes us in the opposite direction. But just as importantly, failing to move quickly enough to enhance economic opportunity for Granite Staters can harm New Hampshire too, as more aggressive states pass us by.

“When governments allow markets to decide what’s produced, how it’s produced and how much is produced, citizens enjoy greater levels of economic freedom,” said Fred McMahon, the Dr. Michael A. Walker Research Chair in Economic Freedom at the Fraser Institute and co-author of this year’s Economic Freedom of North America report, which measures government spending, taxation and labor market restrictions using data from 2020, the latest year of available comparable data.

Rounding out the top five freest states are South Dakota (3rd), Texas and Tennessee (tied for 4th). At the other end of the index, New York is once again the least-free state (4.25) followed by California (49th), Hawaii (48th) and Vermont (47th). For the first time, the U.S. territory of Puerto Rico was included in the index—its score in this first preliminary effort was 2.04. The least-free state’s score was more than twice as high.

Across North America, the least-free quartile of jurisdictions (including Canada and Mexico) had an average per-capita income of just $2,160 compared to $54,927 for the most-free quartile.

“Hundreds of independent studies have produced overwhelming evidence that higher levels of economic freedom are associated with more opportunity, more prosperity, greater economic growth and more jobs,” said Dean Stansel, report co-author and economist at Southern Methodist University.

The Economic Freedom of North America report (also co-authored by José Torra, the head of research at the Mexico City-based Caminos de la Libertad, and Ángel Carrión-Tavárez, director of research and policy at the Instituto de Libertad Económica (ILE) in Puerto Rico) is an offshoot of the Fraser Institute’s Economic Freedom of the World index, the result of more than a quarter century of work by more than 60 scholars including three Nobel laureates.

The report can be read here: EFNA-2022-US-POST

Detailed tables for each country and subnational jurisdiction can be found at www.fraserinstitute.org.

One of the more important New Hampshire stories of the 2022 mid-term elections happened in Massachusetts, where voters approved a so-called “millionaires tax.” That vote represents a pivot back toward the old “Taxachusetts” days when Bay State lawmakers disregarded the interstate competitive effects of their tax policies.

When it takes effect, the “millionaires tax” will levy a punitive 4% tax rate on incomes of $1 million or more. That is on top of the state’s existing 5% income tax. This 80% tax increase for people who earn $1 million or more is likely to motivate a lot of people to seek shelter in places that don’t treat them as cash cows to be milked for the benefit of others.

Massachusetts abuts just one state that does not view people as resources to be exploited. That would be the live-free-or-die state. Accordingly, New Hampshire’s population of millionaires — and people who aspire to that status — should increase a bit in the near future.

The Center for State Policy Analysis at Tufts University estimated that the new tax will raise $1.3 billion next year for the People’s Republic of Massachusetts. That figure would be $2.1 billion, the center estimates, but tax avoidance strategies, including cross-border migration by high-income individuals, will cut the expected revenue by $800 million. 

“Together, cross-border moves and tax avoidance would reduce millionaires tax revenue by roughly 35 percent,” the center concluded.

The $1.3 billion figure represents about 2.5% of the Massachusetts state budget. Advocates argued that the state needed this additional money, even though revenues were so high in the last fiscal year that the state was required by law to return $2.94 billion of state surplus to taxpayers.

This was a revenue grab, not a necessary tax increase. Legislators (who initiated the proposal) wanted more money, but didn’t want to raise general taxes, so they singled out an unpopular minority for excessive taxation. 

Massachusetts residents who expect this revenue to go to roads and schools might be disappointed. The money goes into the general fund, not specifically to those causes. The Boston Globe observed that the narrower-than-expected margin of victory indicates a suspicion among voters that legislators will squander the money. 

“That the measure passed by such a narrow margin — about 52 percent to 48 percent — says more about voters’ mistrust of the Legislature to actually follow through on spending those tax dollars wisely than it does their concern for the state’s wealthier citizens,” The Globe wrote in an editorial after the vote. 

That’s not the only cause for concern. Massachusetts now has a graduated, not a flat, income tax. That creates precedent — and an invitation — for the introduction of other rates above 5%. 

It also represents a shift away from Massachusetts’ efforts to shed its “Taxachusetts” reputation and make itself more economically competitive in the Northeast. If it continues to move in this direction, New Hampshire could enjoy some of the spillover effects, in the form of fleeing investors, entrepreneurs and capital. 

In New England, the poster child for bad tax-and-spend governance is no longer Massachusetts. It’s Connecticut. And we can learn from the Nutmeg State’s nutty management.

Connecticut used to have relatively low taxes and a strong economy. Not anymore. Our friends at The Yankee Institute in Connecticut have chronicled the state’s decline in a recent report titled “Left Behind: Connecticut’s Lost Decade.”

Among its sad revelations:

  • Between 2012 and 2019, the Connecticut economy shrank during 13 of 32 quarters. The US economy shrank in only one (2014 Q1). Compared to other states, Connecticut posted the fourth-worst GDP growth between 2010 and 2019, and the worst among states where GDP didn’t decline.
  • Between 2011 and 2019, the adjusted gross income (AGI) for all U.S. taxpayers increased by 43 percent, but Connecticut’s rose just 23 percent—the third-lowest growth rate.
  • Connecticut in 2019 had 12,190 individuals and households (tax filers) with adjusted gross incomes of $1 million or more, a 28 percent increase from 2011 when it had 9,493. This was the third-lowest rate of increase, with only Oklahoma and West Virginia adding income millionaires at a slower pace. Nationally, the U.S. added about 250,000 income millionaires, an 82 percent increase. 
  • After more than keeping pace with the country in 2010, Connecticut each year created jobs at a slower rate than the nation. From January 2011 to December 2016, Connecticut increased private-sector employment by just 5.6 percent, less than half of the 13.4 percent gain that had occurred nationally.
  • Connecticut lost more residents to other states than it attracted every year from 2003 to 2020.

Warning of the consequences of raising taxes on high-income earners, the Pioneer Institute in Boston recently pointed out that Connecticut once had lower taxes than Massachusetts, and a stronger economy. 

But as Massachusetts shed the “Taxachusetts” label by cutting tax rates, Connecticut went on a taxing binge that brought its total state and local tax burden to the second-highest in the nation.

  • Between 2008-2020, Connecticut ranked 49th in private-sector wage and job growth. 
  • From 2012-2018, Connecticut lost more high-income taxpayers per capita than any other state.
  • Connecticut raised its top income tax rate again in 2015, and in 2016 the amount of tax revenue it raised from the top 100 taxpayers fell by 45%. 

Politicians and activists often take a good economy for granted. They assume that growth and innovation are constants. This is a mistake. Connecticut shows how you really can strangle an economy with bad policies. 

It’s fall fair season, which in New England is known as the most wonderful time of the year. 

Why do people love fall fairs so much?

Because they’re not really fairs. They’re markets. 

And markets make people happy.

The thrill of a fall fair is enhanced by the crisp, autumn air, the foliage, the drive through the countryside to get there, and the sense of excitement that comes with anticipating sweet treats, games, rides, and the bustle of a happy crowd.

But those are all the whipped cream on top of the steaming mug of cider.

The real attraction is the experience of participating in a miniature (and temporary) marketplace.

For all the buzz and excitement, a fall fair is really a self-contained venue for the selling of goods and services. (That the goods and services are peddled by traveling carnies is just a bonus.)

Whether you go in pursuit of funnel cakes and caramel apples or rides, games and other amusements, once you enter the fair you’re basically shopping. 

You run around deciding whether to buy a treat, a souvenir or an experience. You weigh your options, decide what purchases are worth the price, and try to maximize the time and money you have at your disposal. 

There’s no way around it. You’re shopping. 

But it’s shopping with extra stimulation added. (See paragraph five.) 

A big reason we enjoy it so much is that the vendors have learned over the years exactly how to make us happy. 

And after all, that’s the primary objective of any market. 

Ultimately, a market can be defined as strangers inventing ways to profit by making others happy. 

The popcorn peddlers and midway hawkers don’t have any idea who you are. Wherever you came from, whatever you did before, wherever you go after, they don’t care. They have no idea what your politics are, or whether you’ve lived a life of crime or virtue. 

And yet they’re dead set on making you extremely, giddily happy.

Because if you leave happy, they profit, not just this fall but next fall and the fall after that and so on. 

Because they’ve become very good at making us happy, each year when they open the gate, we open our wallets. 

And when we’re all full of cider and candy apples and we’re trying not to fall asleep on the way home, we wish the whole experience would come around more than once a year — so we could repeat the joy of that hours-long series of commercial transactions more often.

If you’ve ever thought about complaining that your favorite fair has been commercialized, well, we hate to break it to you, but the whole fair is an entirely commercial enterprise from start to finish. 

And that’s exactly why you love it so much.