Shopping in tax-free New Hampshire this Thanksgiving weekend would save New Englanders between $31–$40, based on projected spending during Black Friday and Cyber Monday.

According to an annual survey conducted by Deloitte Consulting LLP, consumers plan to spend an average of $567 over the course of Black Friday and Cyber Monday this year. 

That’s a 13% jump from last year’s average. 

The sales tax rate for each New England state (both statewide and local, if applicable) is:

  • New Hampshire: 0%
  • Maine: 5.50%
  • Massachusetts: 6.25%
  • Connecticut: 6.35%
  • Vermont: 6.359%*
  • Rhode Island: 7%

*Vermont is the only New England state that has local sales taxes, which average 0.359% (maximum of 1%). The combined sales tax rate in Vermont, on average, is 6.359%. 

At those rates, the sales tax bill on $567 spent this weekend would be:

  • New Hampshire at 0% = $0 
  • Maine at 5.50% = $31.19
  • Massachusetts at 6.25% = $35.44
  • Connecticut at 6.35% = $36
  • Vermont at 6.359% = $36.06
  • Rhode Island at 7% = $39.69

Spending Black Friday in neighboring Maine turns a $567 bill into a $598 bill. Shopping in Massachusetts turns it into $602, while shopping in Connecticut or Vermont would bring the total bill to $603.

Rhode Island tops the New England Christmas shopping naughty list this year with a total price tag of about $607.

But in New Hampshire, that bill stays put at $567.

The lack of a sales tax is one reason New Hampshire finished first in overall freedom (including No. 1 in economic freedom) in the Cato Institute’s Freedom in the 50 States report, as well as first in economic freedom among all North American jurisdictions in the Fraser Institute’s Economic Freedom of North America 2023

Meanwhile, the five other New England states finished in the bottom half of both rankings. 

New Hampshire shoppers are the real Black Friday winners: In addition to saving up to $40 in sales taxes versus their neighbors, the tax-free shopping environment has stimulated the development of outlet malls and other low-price shopping attractions that help to keep prices low throughout the year.


We’re No. 1!

Again!

Fresh from its No. 1 ranking in the Fraser Institute’s Economic Freedom in North America report, New Hampshire tops the 7th edition of the Cato Institute’s Freedom in the 50 States report.

“New Hampshire is once again the freest state in the Union and in 2022 set the record for the highest freedom score ever recorded in the 21st century. Governor Chris Sununu and the New Hampshire legislature have much to be proud of. In 2000, on the full index, Nevada was number one, just ahead of New Hampshire.”

The Cato report ranks states on 230 variables in the broad categories of economic freedom, personal freedom and fiscal policy.

New Hampshire excels in taxation and government spending. “The state government taxes less than any other state but Alaska,” the report concludes. The state scores well on rankings of government debt, government consumption and government employment.

Although New Hampshire fares well in many categories, our regulatory burden “is a blemish on such an otherwise free state,” the authors write.

Not surprisingly, “the Granite State’s primary sin is exclusionary zoning.” On local land use regulations, “New Hampshire is among the most regulated states.”

The report also dings New Hampshire for not having a right-to-work law or universal school choice, and for imposing a renewable portfolio standard that raises the cost of energy.

Florida, which ranks second in both the Cato and Fraser Institute reports, has improved its position dramatically in the last two decades. The Sunshine state has both a right-to-work law and universal school choice.

New Hampshire has stood atop the Cato rankings since 2011, and the state’s latest score is the highest in the history of the report, which began in 2000. Among the reasons for our high ranking this year was our relatively less burdensome approach to the COVID-19 pandemic. New Hampshire ranked 9th on COVID policies, which is a testament to how badly most states reacted to the pandemic.

But at a Freedom in the 50 States event in Manchester on Thursday, Gov. Chris Sununu and report authors Will Ruger and Jason Sorens all warned against New Hampshire resting on its laurels. The state and local governments still impose many unnecessary constraints on both personal and economic freedom. As long as those restrictions remain, they will continue to be a drag on the economy and give other states opportunities to dethrone New Hampshire from its position as America’s freest state, they said.


New Hampshire is the most economically free state in North America and in the United States, once again edging Florida to top every Canadian province, U.S. state and Mexican state as ranked by the Fraser Institute, Canada’s free-market think tank. 

The Fraser Institute’s 2023 Economic Freedom in North America report, released in partnership with the Josiah Bartlett Center for Public Policy, measures government spending, taxation and labor market restrictions using data from 2021, the most recent year of available comparable data.

New Hampshire surpassed Florida as having the highest level of economic freedom in the U.S., having scored 7.96 out of 10 in this year’s report. Rounding out the top five freest states are Florida (2nd), Tennessee (3rd), Texas (4th) and South Dakota (5th). Puerto Rico came in last with 2.85. The least free states were New York (50th), California and Vermont (tied for 48th), Oregon (47th) and Hawaii (46th).

The Granite State also topped the list of all states in North America, scoring 8.14 out of 10, followed by Florida (8.07), South Carolina (8.06), and then Idaho and Indiana, tied for fourth (8.05). Alberta is the highest-ranking Canadian province, tied for 31st place with a score of 7.90. 

“New Hampshire is proof for all of North America that economic freedom creates maximum opportunity and prosperity,” Josiah Bartlett Center President Andrew Cline said. “The formula is proven, and anyone can follow it. Even Vermont, if it wants to.” 

“The freest economies operate with comparatively less government interference, relying more on personal choice and markets to decide what’s produced, how it’s produced and how much is produced; as government imposes restrictions on these choices, there’s less economic freedom and less opportunity for prosperity,” said Fred McMahon, the Dr. Michael A. Walker Research Chair in Economic Freedom at the Fraser Institute and report co-author.

The report includes an all-government ranking, which adds federal government policy to the index and includes the 50 U.S. states and the territory of Puerto Rico, 32 Mexican states, and 10 Canadian provinces.

Taking into account both federal and state policies, U.S. economic freedom declined from 2003 to 2011, began to recover, and then declined again after 2017. The last two years have seen the lowest levels of measured economic freedom in the U.S. in the last two decades. And while the U.S. remains more economically free than Canada, the gap is relatively small.

“The evidence is clear—lower levels of economic freedom are associated with less prosperity, slower economic growth, less investment, and fewer jobs and opportunities,” said Dean Stansel, economist and research associate professor at Southern Methodist University and co-author of the report.

The Economic Freedom of North America report, also co-authored by José Torra, the head of research at the Mexico City-based Caminos de la Libertad, and Ángel Carrión-Tavárez,  director of research and policy at the Instituto de Libertad Económica in Puerto Rico, is an offshoot of the Fraser Institute’s Economic Freedom of the World index, the result of more than a quarter-century of work by more than 60 scholars, including three Nobel laureates.

See the full report at www.fraserinstitute.org/economic-freedom.

New Hampshire’s cores in key components of economic freedom (from 1 to 10 where a higher value indicates a higher level of economic freedom):

  • Government spending: 8.25
  • Taxes: 7.68
  • Labor Market Freedom: 7.60

About the Economic Freedom Index

Economic Freedom of North America measures the degree to which the policies and institutions of countries support economic freedom. This year’s publication ranks 93 provincial/state governments in Canada, the United States and Mexico. The report also updates data in earlier reports in instances where data has been revised.

For more information on the Economic Freedom Network, datasets and previous Economic Freedom of North America reports, visit www.fraserinstitute.org. And you can “Like” the Economic Freedom Network on Facebook at www.facebook.com/EconomicFreedomNetwork.

Download the entire report here: EFNA-2023-US.


Lost amid all the political and economic news this month was an important bit of data that’s particularly noteworthy as the 2024 governor’s race gets under way. (Yes, already.)

The state’s fiscal year ended in June. When it did, the state posted a General and Education Trust Fund surplus of $538.9 million. 

When revenues exceed budgeted expenses by more than half a billion dollars, that’s notable. Large budget surpluses have so commonplace, though, that they barely prompt a blurb anymore. 

And this is after multiple rounds of business tax cuts that critics said would devastate the state budget and leave New Hampshire with too little revenue to fund basic services.

The surge in business tax revenues (which we documented last year) is one of New Hampshire’s most important economic (and political) stories of the last decade.

It hasn’t stopped. Business tax revenues for the 2022 fiscal year were $323.2 million (or 33.7%) above plan and $68 million (5.6%) above the prior fiscal year.

Looking back to 2012, it’s remarkable how state General and Education Fund revenues have grown. Total revenues for both funds were $3.23 billion in the 2022 fiscal year. In 2012, they were $2.16 billion. 

Inflation (using the national Consumer Price Index) can account for $663 million of that $1.068 billion revenue increase. The rest, about $404 million, is new money.

The other big economic news this month was the achievement of a new record-low unemployment rate of 1.8%. New Hampshire’s economy is churning out jobs and revenue. This isn’t all because of the business tax cuts that have occurred since 2015, but they’ve helped. And the phase out of the Interest & Dividends Tax by 2025 will help more. 

While New Hampshire is enjoying these successes, other states are showing why punishing successful residents with high tax rates is a bad idea.

In Massachusetts, the new 9% income tax rate for millionaires helped to push Celtics star Grant Williams to seek a trade to low-tax Texas.

In April, a new 4% surtax on homes worth more than $5 million took effect in Los Angeles. Movie stars including Mark Wahlberg and Brad Pitt rushed to sell homes before the tax took effect, and since April 1 the supply of homes worth more than $5 million has plunged as owners pulled their listings, according to The Hollywood Reporter. 

California legislators in June had to cover a $32 billion budget shortfall caused by rising spending and falling revenues. Massachusetts is dealing with declining revenues, and current spending proposals for the new fiscal year exceed revenues by about $500 million

Keeping taxes and spending low is paying off for New Hampshire’s economy and the state budget. Having the latest state data confirm that fact yet again, as poster-child progressive states spend beyond their means and send rich residents fleeing, is a good starting point for the governor’s race.

“Very heavy taxes, are hurtful, because they lessen the increase of population by making the means of subsistence, more difficult.”

— John Adams, 1780

Last November, Massachusetts voters approved a so-called “millionaire’s tax.” It raises the state income tax from 5% to 9% for incomes of $1 million or more, an 80% tax increase. 

Four months later, the Massachusetts Society of Certified Public Accountants is sounding an alarm.

After surveying 270 member CPAs, the society in March released a paper titled “Massachusetts is Losing Residents and it’s Getting Worse: Can Tax Policy Changes Mitigate Outmigration?”

The survey of Massachusetts certified public accountants found that:

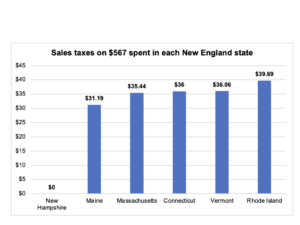
  • 82% of CPAs surveyed indicated that their high-income clients have expressed plans to leave Massachusetts in the next 12 months. Florida and New Hampshire are overwhelmingly the most popular choices for relocation. While some may argue that a move to Florida is driven by a desire for better weather and a different lifestyle, the fact that the second most popular destination is New Hampshire suggests that people want to stay in the area but may be motivated instead by a lower cost of living, including a lower tax burden. Furthermore, New Hampshire is set to repeal its Interest and Dividends Tax by 2026, which would make a decision to relocate even more appealing.

  • 61% of respondents indicated that tax policy is the primary reason their clients are considering leaving the Commonwealth in the next 12 months. 

  • An additional 39% of CPAs indicated that tax policy is a consideration for relocation. 

  • 0% of respondents indicated that tax policy is not a factor in the decision for high-income taxpayers to relocate.

  • More pointedly, half of CPAs said that the new Millionaire’s Tax specifically is the primary reason their clients are considering a move in the next 12 months.

“Some may have been willing to bear Massachusetts’ tax policy in the past, but moving from a five to nine percent income tax rate is an unprecedented 80% rate increase,” the report concluded. “That will undoubtedly inspire affected Massachusetts residents to reconsider their primary residence.”

New Hampshire Business Review reached a similar conclusion after interviewing New Hampshire real estate agents.

Outliers

The Massachusetts CPAs call Massachusetts an “outlier” in the region for its extremely high tax rates and complex tax code. 

“Being an outlier makes it more difficult for the Commonwealth to compete with its regional neighbors and on the national landscape when it comes to attracting jobs, residents and capital investment, but it also violates basic tax principles of neutrality and economic efficiency,” the CPAs wrote.

“The current tax code introduces complexity and incentivizes opportunities to use a domicile change as a tax planning tool, which creates a host of unintended consequences for the state. Before the Millionaire’s Tax Massachusetts maintained a competitive edge in our region with the relatively low, flat individual income tax rate, which helped mitigate other issues such as the uniquely burdensome short-term capital gains tax rate and estate tax. Unfortunately, that is no longer the case.”

Those are words New Hampshire policy makers should always remember. 

New Hampshire is an outlier too, in the other direction. Our lower tax burden has helped to make our state the economic envy of the region, a continental marvel and a haven for tax refugees.

New Hampshire ranks 47th in state tax collections per capita, just a hair worse than Florida, according to a Tax Foundation ranking released this month. 

How do the other New England states fare? They’re all in the top 20. 

Vermont is No. 1, Connecticut 3, Massachusetts 7, Maine 15, and Rhode Island 16. 

New Hampshire collects very little tax revenue per person, compared to our neighbors, and yet we have the region’s lowest poverty rate and a booming economy. And we’re stealing population from the high-tax jurisdictions around us. Funny how that works. 

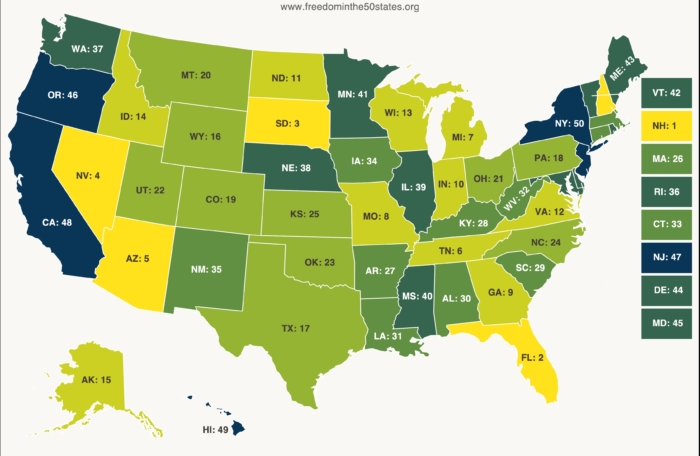
WalletHub, in an analysis also released this month, ranked New Hampshire 48th (third best) in tax burden. Maine and Vermont ranked in the top five, and the rest of the New England states were in the top 20. 

Migration patterns don’t precisely align with tax burden rankings because people aren’t 100% economically motivated, but there’s a tremendous amount of overlap. In 2022, Americans did tend to move from high-tax to low-tax states, as usual, according to several different data sets, including the Census’ own. 

The top in-migration states in 2022 were low-tax Florida, Texas, North Carolina, South Carolina and Tennessee, while the top out-migration states were high-tax California, New York, Illinois, New Jersey and Massachusetts, according to the list compiled by the National Association of Realtors.

Just-released Census data show that six of the top ten counties in the United States for population growth from July 2021-July 2022 were in Texas. The counties that lost the most people were Los Angeles County and Cook County, Illinois, Axios reported. 

The Massachusetts CPAs note in their report that a huge tax rate increase on people who are most able to move, passed right as the rise of remote work has made people less tied to their location, is a recipe for exodus. 

Likewise, a big tax rate cut on the same people, at the same time, would be a strong attraction. Strategically, this year would be the perfect time to accelerate the phase out of New Hampshire’s Interest & Dividends tax. 

Scheduled to phase out over the next four years, the tax remains for now a signal to high-wealth individuals that Florida would be a better relocation destination. 

Like any number of high Massachusetts taxes, the I&D tax is a disadvantage. It weakens New Hampshire’s competitive position and serves as a disincentive to move, or stay, here. 

It’s currently on schedule to be phased out by 2027. The House Finance Committee has recommended moving that date to 2025. Were the state to do that, or nix the tax entirely this year, it would not be lost on high-income individuals, retirees and anyone else with income from interests or dividends that New Hampshire’s tax burden is falling as Massachusetts’ is rising. 

New Hampshire is not listed among the seven states that truly have no income tax. Eliminating the I&D tax would put us on that list and make New Hampshire an even more attractive destination. 

Some might say that we don’t have to make ourselves more competitive if Massachusetts is making itself less competitive. But state tax competition is no longer just regional. 

The rise of remote work makes it even easier for people to shop for a low-tax place to live, regardless of where their employer is located. And the world’s increasing wealth makes it easier than ever for investors, entrepreneurs, retirees and others to move to favorable jurisdictions. 

The Massachusetts CPAs point out that when high-income residents leave Massachusetts, they take their community involvement and charitable giving with them. Making New Hampshire more attractive to these increasingly mobile people benefits not just New Hampshire’s economy, but our communities too. 

While Massachusetts is pushing higher-income residents out, New Hampshire has an opportunity to turn their attention away from Florida and toward the Granite State. 

A surefire way to suppress already low levels of youth employment is to raise the cost of employing younger workers. Some proposals in the Legislature would do that, in the name of helping these same workers. 

One proposal, House Bill 125, would make it illegal to employ 16-and 17-year-olds after 9 p.m. Sunday-Thursday and after midnight Friday and Saturday during the school year. 

Were this to become law, employers would be subject to fines of up to $2,500 each time a high school student clocks out a minute late. (These fines are seldom imposed, according to the state.)

State law currently caps at 35 the number of hours older teens can work during a five-day school week. HB 125 was intended to fix an oversight in a previous revision of youth employment law that inadvertently let teens ages 16 and 17 work up to 48 hours during shortened school weeks. But this particular attempt at a fix would inevitably trigger unintentional violations of state child labor laws. 

The predictable effect of such a law would be to discourage the hiring of high school students, and to reduce the hours of those who are hired. 

New Hampshire already limits youth under the age of 16 to working between 7 a.m. and 9 p.m. Adding a 9 p.m. curfew for older teens would further depress employment in this age group. Teen employment was declining sharply before the pandemic and fell again in 2020. It has not recovered to pre-pandemic levels. 

With a precise time limit on the books, employers would be in violation of state labor law every time a teen doesn’t punch out on time. To avoid being written up for labor law violations whenever a teen gets distracted at the end of his or her shift, employers would end shifts earlier, hire fewer teens, or both. 

As if intended to depress youth employment even further, House Bill 58 would raise the wage for tipped jobs to a minimum of $7.25 an hour. Currently, New Hampshire employers may pay wages as low as $3.26 an hour to employees who earn tips.

HB 58 would set the regular federal minimum as the floor for all jobs, even those with substantial tip income. Were this to become law, restaurants would have to pay all servers an additional $3.99 per hour. The negative effect on employment would be immediate and predictable. 

A University of California-Irvine study published last August found that raising the tipped minimum wage reduced employment. 

“(O)ur evidence is quite clear and unambiguous in pointing to higher tipped minimum wages (smaller tip credits) reducing jobs among tipped restaurant workers, without enough of an increase in earnings of those who remain employed to offset the job loss,” the authors found.

Other research has found that higher minimum wages reduced teen employment, and that “teens exposed to higher minimum wages since 2000 had acquired fewer skills in adulthood.” 

Well-intentioned regulations such as those in HB 58 and HB 125 would end up worsening New Hampshire’s existing labor shortage and hurting the very people they are intended to help. 

In 2019, the U.S. Bureau of Labor Statistics recorded 67,000 employed Granite Staters between the ages of 20-24. In 2022, that number was down to 52,000. 

In 2019, the state estimated the number of waiters and waitresses in New Hampshire at 12,390. In last year’s report, it was down to 7,260, a decline of 41%, even though the entry-level wage was $1 per hour higher. 

Restaurants, already pressed by rising supply, labor and energy costs, have been raising prices to maintain their meager margins. Add in a state mandate to more than double base pay for wait staff, and some restaurants certainly will be forced out of business. Others will raise prices even further. Restaurant prices rose 8.2% from January of 2022 to January of 2023, according to the National Restaurant Association. That’s higher than overall consumer prices, which rose 6.4%.  

According to surveys of New Hampshire Lodging and Restaurant Association members, servers in New Hampshire earn between $20-$45 an hour when tips are included. Granite Staters do tip generously, ranking fifth nationally and first in New England, according to Toast, a Boston company that provides software for point-of-service tablets used by the restaurant industry.

As New Hampshire employers struggle with a labor shortage, persistent inflation and predictions of a looming recession, artificially increasing the cost of employing younger and lower-skilled workers would add an additional burden. As that burden would be tied to the hiring of those workers, it would likely lead to reduced opportunities for them. 

Hurting both employers and younger workers is not the intent of such regulations, but it would be the predicted outcome.  

In the midst of an acute labor shortage that has pushed wages to new highs, a few legislators have opted to introduce another bill to raise New Hampshire’s minimum wage. 

House Bill 57 would raise the minimum wage to $15 an hour by 2025, then tie it to the inflation rate, ensuring regular, automatic increases. 

New Hampshire has about 48,000 job openings, according to U.S. Bureau of Labor Statistics data, and only about 20,000 unemployed persons. 

This imbalance between job openings and available labor has persisted for years. And that has driven wages in New Hampshire higher. New Hampshire Employment Security put the mean average wage at $30.12 an hour in last year’s report (based on 2021 data). In 2019, it was $25.94. 

The average entry-level wage in the 2022 report was $14.36, up from $11.80 in 2019. 

Competitive pressure is pushing wages up to the point that dishwashers have moved out of the list of the 10 lowest-paid occupations in the state. The lowest average wage in the 2022 report belonged to gambling dealers, at $11.59 an hour. Food preparation workers were above that at $12,10 an hour. 

With a booming economy and a severe labor shortage combining to raise wages naturally, the market is already moving compensation in low-paying occupations toward the $15 an hour goal. House Bill 57 would mandate a $13.50 minimum wage by this September. Fast food restaurants regularly advertise jobs well above that rate now, and food prep workers on average are quickly approaching that level. 

Into this discussion, researchers last month dropped yet another study showing that minimum wage increases have costs that can make people who work in the lowest-paid occupations worse off. 

Researchers at the John Hopkins Bloomberg School of Public Health and the University of Minnesota-Twin Cities School of Public Health found that minimum wage increases reduced the number of employers who offered health insurance. 

“We find that a $1 increase in minimum wages is associated with a 0.90 percentage point (p.p.) decrease in the percentage of employers offering health insurance, largely driven by small employers and employers with more low-wage employees. A $1 increase is also associated with a 1.80 p.p. increase in the prevalence of plans with a deductible and three percent increase in average deductibles.”

Though minimum wage hikes led to reductions in employer-sponsored health insurance, they did not lead to increases in uninsured rates, the authors found. That is “likely explained by an increase in Medicaid enrollment,” they wrote.

This study comes on top of decades’ worth of research that, on the whole, tends to find a negative effect on employment — particularly for younger workers and those with less education — from minimum wage increases. 

The preponderance of research on minimum wage increases shows that government-mandated compensation increases are not cost-free. Forcing employers to raise wages in ways that are unrelated to productivity tends to result in shifting resources from other parts of the business. That can include eliminating hours, positions or benefits.

Advocates for high minimum wages seem to assume that employers, including small businesses, simply have troves of cash reserves lying around and pay what they do out of stinginess. But employers generally aren’t sitting on piles of treasure like Smaug in his cave under Lonely Mountain.

And employers can’t simply manufacture more money whenever they want to spend more. Only the government can do that. Employers have to make trade-offs. If the government makes them pay more for low-skilled labor, they’ll take that money from somewhere else. And the results won’t necessarily be net positive for the low-skilled workers legislators intended to help. Usually, the opposite is true. 

In the opening of “The Muppets Christmas Carol,” Gonzo and Rizzo the Rat are selling apples in a dingy London market. Gonzo scolds Rizzo for eating the inventory. 

“Hey, I’m creatin’ scarcity,” Rizzo replies. “Drives the prices up.”

Rizzo is a clever rat.

Later in the movie, the ghosts of the Marleys tell Scrooge how they enjoyed overcharging the poor for rent. (In the Muppets version, there are two Marleys.)

Rizzo didn’t comment on those lines, but he might’ve dead-panned, “maybe someone ate the apartments and drove up prices?”

As Dickens’ classic tale is retold and rewatched this Christmas season, many Granite Staters face a harsh reality that Rizzo — and Scrooge — would understand. Scarcity keeps driving up prices for homes and apartments. 

You don’t need to be visited by the ghosts of housing markets past to see the problem — and why Scrooge would love it. You just have to compare the markets for short-term and long-term rentals.

Demand for short-term rentals has surged nationwide. The number of nights booked in short-term rentals rose 15.8% from October of 2021 to October of 2022, The Wall Street Journal reported last week. 

Investors in short-term rental properties expected prices to rise along with demand. But something happened on the way to sipping daiquiris on the beach as the rent money poured in. A lot of other people responded to the high rates by offering their properties for rent too.

“However, while the absolute number of bookings has risen, there has also been a sharp rise in supply of available short-term rental listings in the U.S., up 23.3% in October 2022 compared with October 2021,” the Journal reported. 

A woman who rents her California home on Airbnb told the Journal, “I’ve felt a massive drop” in rents she can charge. A holiday weekend at her home fell from more than $1,000 per night during the pandemic to around $275 now. Why such a collapse? Demand rose, which drove up prices, and those higher prices prompted investors to increase supply, which brought prices back down. That’s how a market would normally function. 

But it’s not how the market for long-term rentals works. 

In October, median rents were up nationwide by 7.8 percentage points, year over year, according to rent.com. In New Hampshire, the median rent was up 14.12%, by the website’s measure. 

Would-be home-buyers have experienced similar price increases. The median single-family existing-home price was up 8.6% in the third quarter, according to realtor.com. The Union Leader reported Tuesday that the median single-family home price in New Hampshire rose by $34,000 from last November to this November. It’s now $435,000.

For homes, apartments and short-term rentals, demand remains strong. But prices have fallen in only one of those markets: the one where supply faces the fewest constraints.  

“My reaction is that the growth in short-term rentals has come about because people are converting their own homes, or parts of them, into short-term rentals,” said Jason Sorens, director of the Center for Ethics in Society at St. Anselm College and author of the Josiah Bartlett Center’s 2021 housing report. “Rarely do people build units specifically for short-term rental. And that’s where the real housing supply bottleneck is: it’s become harder to build. Without more building, we aren’t going to see a similar supply increase for long-term rentals. But the other point this news shows us is that if we did increase supply, it would reduce rents.”

As we documented last year, overly restrictive local regulations are a significant barrier to new development in New Hampshire. These regulations make it difficult to build new housing, which prevents developers from meeting demand. That creates scarcity, which drives up prices. Rizzo would be proud. 

And Scrooge would be thrilled. Scrooge, don’t forget, was a landlord as well as a money lender. He could get away with charging outrageous rents for decades only if his renters had no cheaper options. So Scrooge would be no fan of loosening land use regulations to allow more apartment and home construction.

If Granite Staters want to avoid turning our existing housing shortage into a Dickensian nightmare, the only solution is to loosen the restrictions and let developers create more supply.   

As Americans and Granite Staters, we have so much to be thankful for that keeping track of it all can be difficult. Where does one begin? 

Family and friends, health and happiness, clean air and water, mountains and maple syrup, having a buffer of at least three states between us and New Jersey. 

Gratitude often comes from perspective. Surviving documents from the settlers who enjoyed the first Thanksgiving in Massachusetts Bay offer a great dose of it. 

Edward Winslow wrote that the men went hunting and fowling, bringing back “as much fowle, as with a little helpe beside, served the company almost a weeke,” and that natives presented five deer to the company for the feast. 

“And although it be not always so plentifull, as it was at this time with us, yet by the goodness of God, we are so farre from want, that we often wish you partakers of our plentie,” he wrote.

The food was so plentiful that year that it inspired settlers to send home letters so unbelievable that Gov. William Bradford felt the need to remark that they “were not fained, but true reports.” The food was all gathered, hunted or fished. There was no Market Basket; the Demoulas family hadn’t arrived yet. 

Here’s your perspective: Imagine living in a world in which enduring the hardships of a colonial settler’s life improved your living standards.

For the Pilgrims, living in the undeveloped Massachusetts frontier was an economic step up. Their idea of abundance was a good harvest (provided by providence) and enough wild game to live on for a week. Even with help from the native inhabitants, the first settlers struggled to produce a subsistence-level supply of food.

Before the Enlightenment unleashed the flood of human ingenuity that created modernity, life was like that for pretty much everyone.

As Enlightenment ideas eroded rigid social hierarchies and unleashed the brainpower of the lower classes (and created a large middle class), an explosion of innovation led to historically unprecedented gains in food productivity.

In 1600, 20 years before the Mayflower landed, the United Kingdom produced enough food to supply its population with 1,877 calories per person per day, according to the data website Our World In Data. That figure was 1,381 in the year 1,300. So over nearly 300 years, the UK gained about 500 calories per person per day.

By 1700, the UK produced 2,229 calories per person per day, for an increase of 352 calories in just 100 years, a huge improvement. 

But in the next 318 years, the UK’s food productivity exploded. By 2018, the country produced a 3,344 calories per person per day, a stunning 50% increase in just over 300 years. 

The United States produced 2,952 calories per person per day in 1800, the year Thomas Jefferson beat John Adams for the presidency. That was about 500 more than the UK, 700 more than Germany and 1,100 more than France. And the industrial revolution hadn’t taken off yet. 

By 2018, the United States was producing a world-leading 3,782 calories per person per day. 

“Almost all that ordinary people used and consumed in the 17th century would have been very familiar to people living a thousand or even a couple of thousand years earlier,” Max Roser explains. “Average incomes (as measured by GDP per capita) in England between the year 1270 and 1650 were £1,051 when measured in today’s prices.”

Then came the Enlightenment, and the great enrichment that followed. 

As Roser puts it, “an average person in the UK today has a higher income in two weeks than an average person in the past had in an entire year. Since the total sum of incomes is the total sum of production this also means that the production of the average person in two weeks today is equivalent to the production of the average person in an entire year in the past. There is just one truly important event in the economic history of the world, the onset of economic growth. This is the one transformation that changed everything.”

This is why the Josiah Bartlett Center for Public Policy puts such a high priority on economic growth. Without it, the world as we know it would not exist. Neglect or smother it, and our descendants will live worse, not better, lives than we do. 

Freedom creates opportunity, which creates abundance, which leads to statistics like this: In the United States today, there are two job openings for every unemployed person. In New Hampshire, there are three job openings for every unemployed person. 

Four hundred years ago, we were in a desperate, daily search for enough calories to survive the next few days. Now, we’re in a desperate, daily search for ways to convince people to stop eating so much.

In the United States, and much of the rest of the world today, prosperity and abundance are so common that they’ve become the default expectation for the vast majority of the population. For that, we will be forever grateful. 

New Hampshire has lost its title as the most economically free state in the union. The top spot this year goes to Florida, by a hair, according to the 2022 Economic Freedom of North America report released today by the Fraser Institute, an independent, non-partisan Canadian public policy think-tank.

Florida scored 7.94 out of 10 in this year’s report (up from 7.78 last year), beating out second-place New Hampshire (7.84).

Economic freedom—the ability of individuals to make their own economic decisions about what to buy, where to work and whether to start a business—is fundamental to prosperity.

“As we’ve pointed out for years, Florida, Tennessee, Texas and other states are serious about gaining a competitive advantage over New Hampshire,” said Andrew Cline, president of the Josiah Bartlett Center for Public Policy. “If we want to have a New Hampshire Advantage 20 years from now, we have to stay focused on expanding economic freedom for all Granite Staters. If we rest on our past accomplishments, we will be left behind.”

Enhancing government control over individuals’ economic choices takes us in the opposite direction. But just as importantly, failing to move quickly enough to enhance economic opportunity for Granite Staters can harm New Hampshire too, as more aggressive states pass us by.

“When governments allow markets to decide what’s produced, how it’s produced and how much is produced, citizens enjoy greater levels of economic freedom,” said Fred McMahon, the Dr. Michael A. Walker Research Chair in Economic Freedom at the Fraser Institute and co-author of this year’s Economic Freedom of North America report, which measures government spending, taxation and labor market restrictions using data from 2020, the latest year of available comparable data.

Rounding out the top five freest states are South Dakota (3rd), Texas and Tennessee (tied for 4th). At the other end of the index, New York is once again the least-free state (4.25) followed by California (49th), Hawaii (48th) and Vermont (47th). For the first time, the U.S. territory of Puerto Rico was included in the index—its score in this first preliminary effort was 2.04. The least-free state’s score was more than twice as high.

Across North America, the least-free quartile of jurisdictions (including Canada and Mexico) had an average per-capita income of just $2,160 compared to $54,927 for the most-free quartile.

“Hundreds of independent studies have produced overwhelming evidence that higher levels of economic freedom are associated with more opportunity, more prosperity, greater economic growth and more jobs,” said Dean Stansel, report co-author and economist at Southern Methodist University.

The Economic Freedom of North America report (also co-authored by José Torra, the head of research at the Mexico City-based Caminos de la Libertad, and Ángel Carrión-Tavárez, director of research and policy at the Instituto de Libertad Económica (ILE) in Puerto Rico) is an offshoot of the Fraser Institute’s Economic Freedom of the World index, the result of more than a quarter century of work by more than 60 scholars including three Nobel laureates.

The report can be read here: EFNA-2022-US-POST

Detailed tables for each country and subnational jurisdiction can be found at www.fraserinstitute.org.