New Hampshire’s housing shortage, and the price spike that it created, has made housing the No. 1 problem facing the state, according to University of New Hampshire polling. Fixing the state’s housing shortage is such a priority for voters that a 2024 UNH poll found more than 1/3 of voters rating it as the top problem, with the No. 2 problem a full 29 points behind. In response, the state House of Representatives has created a standing Committee on Housing to deal with the issue. 

Of the 22 bills referred to the committee, four have been reported out and face a full House vote on Feb. 6. The Josiah Bartlett Center for Public Policy will analyze all 22 bills during this legislative session. Below is our brief analysis of the first four bills to be released for House consideration.

  • House Bill 60, an act relative to the termination of tenancy at the expiration of the tenancy or lease term.

Under current state law (RSA 540:2), a landlord may not terminate a tenant’s lease, even at the lease’s expiration, without cause. The statute lists several causes, including non-payment of rent, substantial property damage, failure to comply with a material term of the lease, behavior that risks health or safety, refusal to vacate for lead paint abatement, or “other good cause.” 

In effect, RSA 540:2 nullifies the time limits on all residential rental contracts. Instead of a one-year lease, the law locks both parties into a permanent lease that can be broken only by bad behavior on the part of the tenant or some other “good cause” that exists outside the terms of the lease and that neither party can predict. 

A lease is a short-term contract in which both parties agree to abide by all stated provisions between the start and end dates. By nullifying the end date of residential leases, RSA 540:2 transfers the use of one person’s private property to another indefinitely, then creates a very limited set of conditions under which the owner can reclaim the use of that property.

This discourages the creation of additional rental housing, particularly duplexes and triplexes. Though the law is a problem for all owners of rental property, it’s particularly tough on individuals and families interested in investing in small-scale rental property. Owners and potential owners of smaller properties that could be put on the market to increase the state’s severely low rental supply are correctly wary of leasing their homes or small investment properties for fear of becoming locked into permanent leases. 

HB 60 fixes this problem simply by recognizing as legally binding the end dates of residential leases. This is a restoration of private property rights that encourage investment in additional rental units.  

  • House Bill 399, establishing a commission to study the New Hampshire zoning enabling act.

HB 399 is probably the most important housing reform legislation of 2025. It establishes “a commission to study the historical evolution of New Hampshire’s zoning enabling act, currently codified at RSA 674:16. The legislative intent is to study the evolution of the New Hampshire Zoning Enabling Act as it turns 100 this year. The goal is to see how the New Hampshire Zoning Enabling Act has changed over time and to consider and make recommendations for future legislation on the balance of zoning powers between the state and municipalities.”

Among the commission’s tasks is to determine whether “the listed powers are still appropriate and/or applicable today, and if any could be removed or if any not present should be added.”

It also would be charged with examining whether the listed purposes of statute that creates local zoning powers are still appropriate or whether any could be removed, and identifying any alternatives to the zoning enabling act.

The Standard State Zoning Enabling Act dates from 1925, and it’s clear that during the last half of its existence, at least, municipalities have used its powers for purposes not strictly aligned with its core purposes of protecting public health or safety and the general welfare. 

The web of regulations spawned by the act has throttled economic growth and left New Hampshire poorer and less vibrant than it would be if not for misguided government interventions, particularly in the housing market. 

The complexity of the problem is a big reason why so little progress has been made despite overwhelming public demand for change. Rather than continue to address each discrete issue one at a time, HB 399 would authorize a comprehensive review, one that is long overdue. A top-to-bottom study of how zoning contributed to the state’s housing crisis, along with recommendations for how to untangle the regulatory web, is likely the only way to achieve comprehensive reform. 

  • House Bill 444, an act relative to a tenant’s right to notification prior to the sale of a multi-family home.

HB 444 would forbid owners of restricted multi-family residential property from closing a final sale or transfer of the property without first giving “60 days’ notice and the opportunity to make an offer to each tenant in the same manner and according to the same procedures required of a manufactured housing park owner in RSA 205-A:21.” 

In short, owners of apartment buildings with five or more units, and owners of more than three single-family rental homes, would be prohibited from selling their rental properties without first giving every renter two months in which to make a purchase offer. 

Owners of mobile home parks face the same restriction under RSA 205-A:21. But there’s a huge difference between apartment renters and mobile home park residents. Mobile home park residents own their homes. They typically rent the land. And they often have associations through which they handle property rental issues. 

RSA 205-A:21 is designed to regulate property sales that involve multiple property owners. That’s not the case with apartment renters. Applying the regulations governing mobile home park sales to apartment building sales would only create confusion and delay. Unlike mobile home owners, renters do not have collective associations, do not have a long-term financial investment in the property, and typically do not have the financial resources to purchase even a small home, much less an apartment building.

HB 444 does not fix any of the regulatory problems that contribute to New Hampshire’s housing shortage, but instead would create another one. 

  • House Bill 623, relative to prohibiting corporations from purchasing single-family homes for a certain amount of time.

It’s not clear what problem HB 623 is trying to address. Institutional investors are not heavily engaged in the single-family home rental market in New Hampshire. In fact, a General Accounting Office study in 2023 found that institutional investors accounted for only 3% of the national single-family home rental market, predominantly in the South, Midwest and West. 

That study concluded that the huge and sudden increase in institutional investor purchases of single-family homes was driven by the 2007-09 financial crisis and federal policies that followed it.

Fannie Mae’s 2012 REO-to-Rental Initiative bulk auctioned thousands of single-family homes for the purpose of converting these homes to rentals. In 2017, “Fannie Mae backed a 10-year, $1 billion loan to Invitation Homes (one of the largest investors in single-family rental housing) to purchase and manage single-family rental homes,” the GAO report explained. “Freddie Mac subsequently launched a pilot program designed to provide liquidity and stability for mid-sized investors (generally those with 50–2,000 properties) and uniform credit standards on loans for single-family rental properties.”

Rather than emerging as a predator, institutional investors answered the federal government’s call to rapidly increase the supply of rental homes by buying and converting foreclosed properties. They later moved into building their own rental homes, expanding the nation’s supply of rental housing. 

The GAO report found that the rental homes run by institutional investors are concentrated in the South and Midwest, with some presence in the West, all areas hit hardest by large-scale home foreclosures following the financial crisis. Most New Hampshire homes owned by businesses “can be attributed to individuals or small investors using an LLC to buy the home,” according to the New Hampshire Association of Realtors. 

There simply isn’t a problem with institutional investors buying up homes in New Hampshire. So HB 623 offers a solution to a problem that doesn’t exist. Yet its passage could still harm New Hampshire. The bill prohibits the purchase of single-family homes by “non-natural persons” (businesses) “until the property has been on the market for 90 days.” It contains a few exceptions. The first allows the purchase of residential housing by businesses for the purpose of converting it to a non-residential use. This, perversely, would encourage businesses to remove existing stock from the state’s housing inventory. 

Like HB 444, not only does HB 623 address a non-existent problem, but it would create a real one. 

Download this policy brief here: First Four Housing Reform Bills 2025.

From local elections to legislative debates to legal challenges, discussion of public education in New Hampshire has been dominated by two persistent myths.  The first is that more spending is the primary means of producing better educational outcomes.  The second is that our educational outcomes are stunted because funding for K-12 public schools has “been slashed,” as a common talking point asserts.

Because of these myths, instead of focusing on school leadership and proven, outcome-based measures of success, voters and policymakers have too often devoted their efforts toward improving fiscal inputs. 

In a new policy brief, the Josiah Bartlett Center for Public Policy reviews the last few decades’ worth of public education spending in New Hampshire, along with student performance measures, to help Granite Staters understand that the relationship between spending and outcomes is not as simple as its proponents claim.

Spending doesn’t equal “investment”

When every dollar spent on K-12 district schools is treated as an “investment,” regardless of how it is spent, it should not be surprising that results do not meet expectations. The data show clearly that New Hampshire, along with the rest of the United States, has made the critical error of equating spending with investment. If the two terms were synonymous, our student performance would look very different. That New Hampshire has made this simple category error for so long is not merely unfortunate.  It has had negative consequences for generations of students.  

Between 2001-2019, public schools in New Hampshire increased their total expenditures per student on an inflation-adjusted basis by 66.8 percent, from $11,336 in 2001 to $18,905 in 2019. This means that New Hampshire public school students had 66.8 percent more in inflation-adjusted taxpayer funding devoted to their education in 2019 than in 2001.

The trends have not changed since 2019. Today, New Hampshire spends $3.9 billion on K-12 public education, for an average per-pupil cost of $21,545 when counting only operating expenditures, or $26,320 when counting total expenditures (including non-operating expenses such as capital and debt). Enrollment since 2019 has fallen by just shy of 12,000 students.

On top of that, New Hampshire received about $630 million in federal COVID-19 relief money directed toward public education.  The Manchester School District alone received $91 million, Nashua 44.4 million. 

One would expect large gains from such huge fiscal inputs. But those returns have not materialized.  

Our research has shown that New Hampshire public school districts (and local voters) choose to increase spending annually, independent of enrollment, and the new money tends to fund additional staff.  One would expect spending to rise as enrollment rises.  But spending also rises when enrollment falls.  This drives per-pupil spending higher, as districts collect and spend more money on fewer students. 

Spending more money on fewer students is exactly what was supposed to lead to higher educational outcomes.  Parents have been told for decades that schools could offer higher quality services if only they had the resources to hire more staff and reduce class sizes. 

In New Hampshire, those two input goals have been achieved. With rising revenues and declining enrollments, public school districts have hired thousands of additional staff and cut class sizes. The state caps class sizes at 25 students in grades K-2, and 30 students in grades 3-12. Yet schools are not close to those caps, with a state average class size of just 16.9 students. In the 1993-94 school year, New Hampshire averaged 21.8 students per elementary school class and 20.8 students per secondary school class. 

The chart below shows that New Hampshire’s K-12 district public schools hired 10 times as many staffers as all other state and local government combined (excluding higher education) from 2001-2019. This hiring spree dwarfed all other state and local government hiring even as K-12 schools lost students and the state population (people served by non-school agencies) grew.Spending and ROI

Voters are often misled into thinking that additional spending by itself is the best way to improve student outcomes.  But that is demonstrably untrue. Higher spending is not an escalator that brings students automatically to higher achievement, as the below chart, republished with permission from the Edunomics Lab at Georgetown University, shows.

Some level of spending on educational services obviously is essential to the provision of a quality public education.  Educators can’t do something with nothing. But beyond a certain point, additional spending does not produce better results. The data on K-12 spending and student performance in New Hampshire going back decades strongly suggest that we are past the point of diminishing returns.

Since additional dollars are not producing additional gains (and have instead coincided with performance declines), it’s imperative to reassess our thinking about how to get a better return on investment (ROI) for our education dollar. Spending itself is not an investment.  

Consider special education services. The Edunomics Lab reviewed data on special education spending and outcomes, concluding that “states with higher identification rates of learning disabilities do not deliver better reading outcomes for these students. Nor are states with comparatively more staff-intensive special education programming producing higher reading scores.”

Their research and that done by other academics has found that simple small-group reading interventions can produce significantly better outcomes for students with severe reading deficits than more expensive special education services do.

Examples like these show that strong gains can be produced with simpler, less-expensive inputs than many schools currently use. That doesn’t mean that less costly alternatives will work for every student. But that they have been shown to work better for many students illustrates that savings can be found while improving student outcomes.

So how do we find those high-ROI activities in which to invest our limited education dollars? That is the question all Granite Staters interested in public education need to ask. It’s clear that simply writing bigger checks is not a sufficient answer. Yet the search for better answers is hindered by a persistent belief that no search is necessary as long as taxpayers fund large school budget increases every year. Until we overcome that obstacle, we’ll continue to break education spending records without generating the kind of returns our students need.

In the press release announcing the disappointing 2024 Nation’s Report Card results, Beverly Perdue, chairwoman of the National Assessment Governing Board and former Democratic Gov. of North Carolina, made the following statement:

“This is unacceptable especially for our lowest performing students. We need to invest more in the data-informed efforts that have been shown to work so that we lift up our students and accelerate their learning even further.”

That’s right. Americans have spent decades increasing K-12 education spending on the theory that higher fiscal inputs were the missing ingredient in the recipe for student success. That theory has been proven wrong.  As Gov. Perdue suggested, it’s time to focus less on the district finance office and more on the classroom.

Download the full policy brief here: JBC Brief Spending & Outcomes.

Labor unions negotiate benefits on behalf of all employees of a collective bargaining unit, not just their own members, unions say. Since non-members receive the benefits, they should be compelled to pay the union for negotiating them. 

Because right-to-work laws forbid non-union employees from being compelled as a condition of employment to pay any portion of their wages to a labor union or a union’s third party affiliate, they turn non-members into freeloaders, unions say.

At a public hearing on Wednesday, opponents of House Bill 238, this year’s right-to-work bill, made liberal use of this freeloader fallacy.

The freeloader argument has three parts.

  1. Unions are required by federal law to represent non-members.
  2. Non-members benefit from union representation itself.
  3. Non-members benefit from the results of union representation.

Piling fallacy atop fallacy

Several speakers at Wednesday’s hearing used the American Automobile Association (AAA) as an analogy. 

Imagine that a driver who never joined AAA gets in an accident, then calls AAA for roadside assistance. AAA would rightly refuse the request. Right-to-work laws do the equivalent of making AAA provide assistance to non-members, they claimed.

In defending one fallacy, these speakers committed another, the false equivalence fallacy.

First, AAA is nothing like a union. If AAA worked like a union, instead of sending you a tow truck, it would send you a lawyer to negotiate with a towing company. 

Further, under federal law, if a majority of a bargaining unit’s employees vote to form a union, that union represents all employees. (Which is what unions want.)

AAA enjoys no such monopoly status. It sells memberships in the open marketplace. 

There are two ways the AAA analogy could work. 

AAA could make these five changes:

  1. Unionize licensed drivers.
  2. Obtain federal certification as the only provider allowed to negotiate benefits for all drivers.
  3. Secure agreements with a third party to provide those benefits.
  4. Let only members vote on the benefits packages the third party will offer.
  5. Obtain authorization to charge non-members for these negotiation services.

The other option is for unions to operate like AAA. They could do this in three steps:

  1. Forego federal certification, thus opening their workplaces to other unions.
  2. Provide benefits (such as insurance, paid leave, etc.) to their members, rather than negotiating for employers to provide them. 
  3. Compete against other unions on price and quality to attract more members.

Tellingly, unions do not want option two. 

Who benefits from the benefits?

Unions claim that right-to-work is unfair because all employees enjoy the benefits of union representation. 

These benefits fall into two categories: 1. The compensation packages unions negotiate, and 2. Union representation itself.

Representation

Putting your workplace negotiations in the hands of a third party involves a great deal of trust. It also means sacrificing your autonomy as an employee. Your compensation is no longer dependent on your performance, but on your group status.

That tradeoff can make one better off. Or it can backfire. Union representation isn’t always in the best interests of a union’s own members, much less non-members.

In 2009, Gov. John Lynch had to cut $25 million in labor costs from the state budget. He offered rotating furloughs to workers so no one would have to be fired. The State Employees Association said no, choosing layoffs instead. The governor laid off 250 state employees. They clearly were made worse off by the union leadership’s inept negotiations.

Union contracts that favor seniority over merit disadvantage young, ambitious workers, making it harder for them to advance up the career ladder.

Benefits

Even if workers don’t like the idea of being represented in this way, unions say they are made better off by the compensation packages negotiated on their behalf, so they still must pay for the representation they don’t want. But that argument also fails on closer examination.     

During Wednesday’s hearing, Rep. Daniel LeClerc, D-Amherst, made the case that unions negotiate better benefits for employees. His own union benefits include no employee share for health insurance, he said. Because his employer covers the entire expense, he gets health insurance at no cost to him.

That might be a great deal for Rep. LeClerc. But of course he does pay for that insurance coverage. Instead of higher wages, he receives a larger portion of his compensation in the form of health insurance coverage. 

Health benefits aren’t bonus compensation. They’re a trade of cash for coverage. Employees pay for benefits by receiving lower wages than they otherwise would receive.

In the United States, private sector employees on average receive 70% of their compensation in wages and 30% in benefits, according to the Bureau of Labor Statistics.

In manufacturing, the breakdown is 66.5% wages and 35.5% benefits.

The government classifies all of this as compensation. So do employers.

Union-negotiated compensation packages are not “freebies” given to employees by a union. They are compensation packages negotiated between union representatives and employers. And those packages favor some employees over others. 

Benefits preferences vary by age, marital status, sex and other factors. Those preferences can be highly personal. 

A 2024 Ford Motor Co. survey found that only 33% of American Baby Boomers would take a 20% pay cut in exchange for a better quality of life, but 60% of Millennials would.

A young employee who would gladly exchange a lower wage for more flexible hours is made worse off by a union contract that makes the opposite trade. 

When union leaders, who tend to be older, negotiate a package heavy on pension contributions that require a decade to vest, younger workers who intend to stay for fewer than 10 years are harmed. 

Gen. Z Americans stay in a job for about 1/4 as long as Baby Boomers do. 

Because federal law gives a certified union monopoly status as the exclusive bargaining agent for employees, the individual employee is stuck with whatever package the union leadership negotiated.

Unions suggest that the choice is between benefits and no benefits. It’s not. It’s between one discrete package vs. any number of other possible packages. 

Many employees who give up their autonomy to a union might well be better off in the long run. But not all of them will be. In a free country, no one should be made to trade his workplace autonomy for collective representation.

Forced representation

That tradeoff is the issue. Unions claim that they make all workers better off. This is demonstrably untrue. Some workers are made worse off by losing their workplace autonomy. 

Unions say they are required by federal law to represent non-members. But they sought that law. And it applies only if they pursue and accept National Labor Relations Board certification as the exclusive collective bargaining representative for a bargaining unit. That is, only if they seek and accept government designation as a monopoly provider.

Unions could request decertification and represent only their members. They could further seek to change federal law if they see it as such a burden.

But that would put an end to collecting fees from non-members who would stop paying those fees if given the choice. 

Far from creating freeloaders, right-to-work laws restore a measure of financial autonomy to workers. Unions in right-to-work states can no longer behave as monopoly providers, but must convince non-members to join. That changes their behavior and makes them more responsive to the needs and preferences of all members of a bargaining unit.

Introducing this market incentive is the only way to improve the percentage of workers who will actually benefit from union representation.

The State New Hampshire and its towns and cities provide the opportunity to obtain a publicly funded education to every school-age child, regardless of income.

And no one complains that this unfairly benefits higher-income households.

To illustrate the point, the median household income in Hopkinton is $130,216. That’s 55% higher than in Concord ($83,701) and 36% higher than the statewide median household income of $95,628, according Census data.

Yet the state doesn’t try to lower costs by telling Hopkinton to close the schoolhouse doors to its more prosperous families, who, after all, could probably afford private school tuition. 

The state certainly could means test public education services, treating public education like a poverty relief program. But it does not. Why?

Because New Hampshire has always considered public education a core government service provided to all, like roads, courts and public safety services.

And that is how Granite Staters use public education. 

Currently, 75% of New Hampshire households earning more than $200,000 a year send their children to public schools, according to Census data. The state doesn’t tell those children that their families make too much money to access public education. Yet the state says exactly that to children who want to use Education Freedom Accounts and Tax Credit Scholarships. 

Though eligibility is capped at 350% of the federal poverty level, Education Freedom Accounts are not an anti-poverty program. The income caps were established to prevent the new program from being overwhelmed in case initial demand was high, and to limit the initial fiscal impact on the Education Trust Fund. They were a temporary measure to ensure a successful rollout of the program. 

These eligibility limits are similar to those placed on the tax credit scholarship program, and for similar reasons. Initially, 70% of tax credit scholarships were reserved for students enrolled in a district public school. But that percentage declines over time.

New Hampshire has five methods of delivering a public education to students:

  1. District public schools;
  2. Chartered public schools;
  3. Town tuitioning;
  4. Tax Credit Scholarships;
  5. Education Freedom Accounts.

The first three options are available to all students, regardless of income. The last two are income-restricted. 

The difference between methods 1-3 and methods 4-5 is that parents are empowered to choose the source of their child’s education in the latter two methods. It is NOT that students can attend non-public schools.

Through the town tuitioning program approved in 2017, New Hampshire already pays for students of any income level to attend a private school if their local district does not offer a public school in their grade span. 

There are two primary difference between town tuitioning and the EFA programs. 1. The EFA program costs taxpayers a fraction of tuitioning, as students have access only to their state adequacy grant and not the local portion of their public education allotment. 2. The non-district educational options are limited in the tuitioning program to approved schools selected by the local district.

In other words, New Hampshire already has a public education program that funds private school education, costs more per pupil than the Education Freedom Account program and includes students of all income levels.

Education Freedom Accounts operate under a similar principle to the town tuitioning program. If the local district school does not offer the services the student needs, the student can shop for an education provider that does. 

The difference is that the town tuitioning program presumes that a student will receive the education he or she needs in his or her assigned public school. The EFA program acknowledges that this is not always the case.

Though New Hampshire’s public schools are among the best in the nation, not every child thrives in his or her assigned public school. Many students, regardless of income, would find a better educational fit elsewhere (including in a different district school). 

This is no trivial matter. Finding the right educational environment can change a child’s life. It can mean the difference between long-term success or failure. 

House Bill 115 would allow New Hampshire families to match their child to the education that best fits that child’s needs. 

We know from school choice programs in other states that empowering parents to shop for education does not destroy local public schools. On the contrary, it improves them, as market competition improves costs and services in all industries. Of 29 quality studies done to test the performance of public school students after the introduction of a school choice program, 26 have found positive effects.

Likewise, claims that universal eligibility for Education Freedom Accounts will immediately cost the state $100 million are unfounded.

No school choice program in the United States has 100% enrollment of eligible participants. 

In the first year of New Hampshire’s EFA program, just 15% of eligible private school students enrolled. In 2024, only 24.6% of eligible private school students were enrolled. 

Data from New Hampshire and other states show that private school take up rates start relatively small and grow over time. And still, even the oldest programs do not have 100% enrollment.

If legislators are concerned about the initial cost of expanding EFA eligibility, there are ways to phase in access to the program that don’t involve income caps, which violate the state’s longstanding principle of providing a public education to all school-age children.

Ultimately, the argument against universal EFAs is not an argument against providing a public education to higher-income families. New Hampshire already does that. It’s an argument that higher-income families might actually prefer this option if it’s given to them (which doesn’t express a lot of confidence in district public schools).

But that’s not an argument for denying all students this option. It’s an argument for using this option to improve district public schools, making them more attractive to families, which is what volumes of research on school choice suggests will happen.

Universal eligibility would give every New Hampshire student access to an education that works for that individual child, which is something the current system does not achieve. That would fulfill the promise of public education while also creating the competitive forces necessary to drive improvements in the traditional public school system. In the end, all children would win, regardless of which educational option they chose. 

But that universal win can’t happen without universal access to education freedom. 

People have always relocated between New Hampshire and Massachusetts, for a variety of reasons. But the flow from Massachusetts into New Hampshire is larger than the outflow, and it has been increasing, an analysis from the Pioneer Institute in Boston shows. 

From 2010-2023, New Hampshire gained a net total of 98,879 immigrants from Massachusetts, nearly enough to create another city the size of Manchester. (These figures exclude the pandemic year of 2020.)

Florida was the No. 2 destination for Bay Staters during those years, with the Sunshine State gaining a net 90,372 new residents from Massachusetts.

“In 2023 an estimated 184,534 individuals over a year old left Massachusetts for other states while 145,021 relocated here from other states. That means that on net the Commonwealth lost 39,513 domestic residents,” the Pioneer Institute’s debut Mapping Mass Migration newsletter shows.

“Net out-migration remains elevated, with Massachusetts losing more domestic residents each year from 2021 to 2023 than it did in 2019 (no ACS data is available for 2020). In total, net out-migration has increased exponentially over the last decade; out-migration levels were 10 times greater in 2023 than they were in 2010.”

The Mass. exodus is costing the state billions. 

“Massachusetts lost $10.6 billion in adjusted gross income (AGI) to net out-migration between 2020 and 2022, more in those three years alone than the $10 billion it lost from 2012 to 2019,” a separate Pioneer Institute study in November concluded.

“In all, the Commonwealth experienced a four-fold increase in AGI loss from 2012 to 2022,” the study found. “The net loss of taxpayers followed a similar pattern, rising from just over 6,000 in 2012 to more than 26,000 in 2022.”

A University of New Hampshire analysis found that from July of 2023 to July 0f 2024, Massachusetts, Connecticut and Rhode Island lost more U.S. residents than they gained, but mitigated those losses with “a substantial influx of immigrants.” 

In Massachusetts and Connecticut, “immigration provided over 90 percent of their substantial population gain. In Rhode Island, immigration produced the entire population gain,” the UNH Carsey School of Public Policy analysis concluded.

The Pioneer Institute analysis also noted Massachusetts’ foreign immigrant boom.

“While Census Bureau population estimates show an increase of 18,481 people in 2023, that was largely thanks to an influx of 50,000 new foreign immigrants. Without them the state would have lost significant population,” Pioneer noted.

New Hampshire and Maine were the only New England states to have more domestic in-migration than out-migration from July of 2023 to July of 2024, and the only ones to have more domestic than foreign in-migration, the UNH analysis showed.

The cost of living in Massachusetts is a major factor in the state’s population loss, and New Hampshire’s comparatively lower cost of living is a major factor in our state’s attractiveness.

“To make Massachusetts more competitive and attractive to current and potential residents and employers, Massachusetts needs to do more to lower its overall cost structure. Affordability solutions from growing the housing supply, easing tax burdens, and improving public transportation must be considered,” the Pioneer Institute’s December analysis concluded.

Likewise, finding ways to further lower the cost structure in New Hampshire would help keep the state competitive and potentially reduce the outflow of younger adult residents. 

That’s why regulatory reforms that allow for more residential and commercial development, more educational competition, and more occupational freedom (including right-to-work and reduced licensing requirements) are so important, along with lowering energy costs.

Lightening regulatory burdens and expanding market competition are proven ways to lower costs and improve service quality, both of which would make the state more attractive to employers and our own young people.

New Hampshire is the freest state in the country and on the continent. But on some measures of economic freedom, we do poorly. Most Granite Staters would probably be surprised to learn that New Hampshire is in the top 20 most regulated states in the nation.

New Hampshire’s recent regulatory growth

Researchers at the Mercatus Center at George Mason University have tracked the growth of state regulations since 2019. New Hampshire ranks as the 18th most heavily regulated state. We are more heavily regulated than every other New England state save Massachusetts, which ranks 9th. 

From 2019-2023, the number of state regulatory restrictions in New Hampshire grew by 14%, rising from 123,423 to 140,893, according to Mercatus’ tracking. 

Policy areas in which New Hampshire’s regulations exceed national averages include:

  • broadcasting
  • health services
  • environmental protection, public utilities and natural resources,
  • taxes and public finance

While state policymakers have focused in recent years on aiding economic growth by lowering business tax rates, the state’s regulatory burden has grown steadily, likely countering some of the positive tax cut effects.

Cutting regulations can stimulate growth. The Canadian province of British Columbia did it successfully, starting in 2001 with a reform requiring two regulations to be cut for every new one added. The regulatory cuts flipped the state’s economic growth rate from lower than the national average to higher, a Mercatus Center study has shown. 

Regulatory reform in other states

Several U.S. states offer ideas for how to reduce regulatory burdens:

Rejecting the Massachusetts model

Gov-elect Kelly Ayotte has promised to keep New Hampshire from becoming Massachusetts. In the area of government regulations, New Hampshire has been creeping in Massachusetts’ direction. Taking swift action to reverse this regulatory growth would reduce state interference in the private sector and improve economic freedom without requiring any new state spending. Reducing state rules might even have the effect of trimming state spending, as fewer rules could mean fewer bureaucrats.

Download this policy brief here: Policy Brief Regulatory Reductions 2025

Reviving American manufacturing is a hot topic in the nation and New Hampshire once again. A new Department of Business and Economic Affairs report on the state’s advanced manufacturing sector has drawn attention to that field’s recent growth here (well above the New England average) as well as its economic benefits (tens of thousands of jobs, billions in economic output).

Policymakers hoping to help specific industries tend to suggest protectionist measures (such as tariffs). But with manufacturing, as with the economy as a whole, recent research shows that enhancing individual freedom by repealing protectionist regulations is a more effective way to stimulate significant job growth. 

To create a surge in domestic manufacturing jobs, all a state has to do is pass a right-to-work law. 

Right-to-work laws do not prohibit unionization or collective bargaining. Unions remain perfectly legal and capable of organizing and bargaining for their members in right-to-work states. The laws simply prohibit employers from transferring any portion of non-union workers’ pay to unions without the workers’ consent. 

Several recent studies have found that the adoption of right-to-work laws causes a significant increase in manufacturing jobs. 

  • A 2021 Harvard University study found that the adoption of a right-to-work law led to a 28% increase in manufacturing jobs in counties that bordered a state without a right-to-work law. Moreover, those jobs were net gains, not substitutions. Right-to-work counties had employment-to-population ratios 3.51 percentage points higher than their neighbors over the border. The researchers also found that the newly right-to-work counties experienced increased levels of in-bound commuting from over the border. For New Hampshire, that would mean fewer people commuting to Massachusetts for work and more people commuting from Massachusetts into New Hampshire. 
  • “Job creation in industrial sectors such as manufacturing especially improves under Right-to-Work laws,” a 2015 Illinois Policy study showed. “Since Indiana passed its Right-to-Work law, Hoosier manufacturing jobs increased by 44,500, while Illinois lost 8,300 manufacturing jobs in the same time period. And Michigan added 46,900 manufacturing jobs since it enacted Right to Work, while Illinois lost 10,900 factory jobs during that time.”

New Hampshire had 70,000 manufacturing jobs as of 2022. A 20-28% increase in manufacturing employment triggered by adoption of a right-to-work law (the range between the Mackinac Center and Harvard studies) would mean the addition of between 14,000-19,600 new manufacturing jobs in New Hampshire. 

If we cut those estimated effects in half, that still would represent 7,000-9,800 jobs. For comparison, the population of Litchfield is about 8,500. 

If New Hampshire policymakers want to improve the state’s manufacturing sector without spending a dime of taxpayer money, there’s a very simple way to do it. Pass a right-to-work law. 

New Hampshire is once again the freest state both in the United States and on the North American continent, topping each index in this year’s Economic Freedom of North America report, released today by the Josiah Bartlett Center for Public Policy in conjunction with Canada’s Fraser Institute.

“Granite Staters continue to choose policies that empower people, not government. When you do that for a very long time, you wind up freer than your neighbors,” said Andrew Cline, president of the Josiah Bartlett Center for Public Policy, which partnered with the Fraser Institute in releasing the report. “In 2025, legislators have a tremendous opportunity to build on this success and liberate Granite Staters from some of the outdated policies that keep us from being even freer.”

Since the Fraser Institute began publishing its Economic Freedom of North America Index two decades ago, the Granite State has ranked No. 1 in 23 of the 26 years studied in the international freedom index. It has ranked No. 1 in 23 of the 42 years covered in the U.S. freedom index.

New Hampshire Gov. Chris Sununu said that notching another first place win shows that New Hampshire’s approach to governing works.

“The model we’ve set here in New Hampshire isn’t just the gold standard for the 50 states, it’s the envy of all North America! The New Hampshire Advantage is more than just a slogan — it’s proof that freedom stems from creating opportunity for the individual without big government,” Sununu said.

This year—the 20th year that the Economic Freedom of North America index has been published—New Hampshire is again the freest state among all U.S. states, having scored 8.12 out of 10 in this year’s report, which measures government spending, taxation, regulations and labor market restrictions using data from 2022, the most recent year of available comparable data.

“In the freest economies, individuals are allowed to make more of their own economic choices—choices concerning work, transactions with others, and owning and using productive property. As government limits these choices, people have less economic freedom and as a result they tend to be worse off,” said Matthew Mitchell, a senior fellow at the Fraser Institute and co-author of the report.

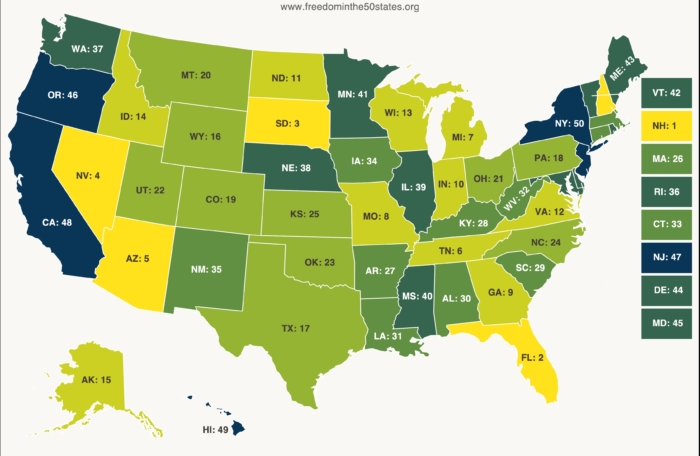
Rounding out the top five freest states are South Dakota (2nd), Florida (3rd), Tennessee (4th), and Texas (5th).

Once again, Puerto Rico came in last among U.S. jurisdictions with a score of 2.13 out of 10. The least free U.S. states were New York (50th), California (49th), Hawaii (48th), New Mexico (47th) and Vermont (46th).

Among the remaining New England states, Massachusetts ranked 28th, Connecticut 29th, Maine 38th, Rhode Island 42nd, and Vermont 46th, making New Hampshire at No. 1 the only New England state to rank in the top half of states for economic freedom.

The report also includes an all-government ranking, which adds federal government policy to the index and includes the 50 U.S. states and the territory of Puerto Rico, 32 Mexican states, and 10 Canadian provinces.

Taking into account both federal and state policies, economic freedom peaked in 2004 then declined and bottomed out in 2009. From 2009 to 2017, economic freedom in North America slowly increased, but has remained more than a quar­ter-point below its 2004 peak ever since. In fact, average economic freedom across all 93 jurisdictions in the index has fallen every year since 2017 and is now only 0.02 points above its all-time low.

And even though the U.S. remains more economically free than Canada, the gap is relatively small.

“The evidence is clear—higher levels of economic freedom are associated with more prosperity, faster economic growth, more investment, and more job opportunities,” said Dean Stansel, economist and research associate professor at Southern Methodist University and co-author of the report. According to the report, total employment grew about three times faster in the most economically free U.S. states than it did in the least free over the last decade.

The Economic Freedom of North America report is co-authored by José Torra, the head of research at the Mexico City-based Caminos de la Libertad, and Ángel Carrión-Tavárez, director of research and policy at the Instituto de Libertad Económica in Puerto Rico. It is an offshoot of the Fraser Institute’s Economic Freedom of the World index, the result of more than a quarter century of work by more than 60 scholars, including three Nobel laureates.

See the full report at https://efotw.org and fraserinstitute.org/studies/economic-freedom.

New Hampshire’s scores in key components of economic freedom (from 1 to 10 where a higher value indicates a higher level of economic freedom), from 2021 to 2022:

  • Government spending: Unchanged, at 8.84 both years
  • Taxes: changed to 7.47 from 7.18
  • Labor Market Freedom: changed to 8.34 from 7.93

Read the entire report here: us-economic-freedom-of-north-america-2024

New Hampshire is the No. 3 state in the country for outbound cigarette smuggling, resulting in a revenue windfall, concludes the latest annual report on interstate cigarette smuggling from the Tax Foundation and Mackinac Center for Public Policy.

From 2007-2022, New Hampshire earned $955 million in state revenue from cigarette buyers who then smuggled their purchases to higher-tax states, according to the report.

(At $1.78 per pack New Hampshire has the lowest tobacco tax rate north of Virginia.)

The study’s data, from 2022, “demonstrate that when states increase their cigarette taxes, smuggling rates increase, both in the form of increased purchases in neighboring states and through illicit international channels,” the report concludes.

“Higher tax rates incentivize smuggling. As tax rates increase, consumers and suppliers search for ways around these costs. In cigarette markets, consumers tend to shop across borders where the tax rates are lower and dealers develop black and gray markets to sell illegally to consumers, paying little or no tax at all. Growing cigarette tax levels and differentials have made cigarette smuggling both a national problem and a lucrative criminal enterprise,” the report states.

“A primary driver of the amount of cigarette smuggling is the relative magnitude of that state’s excise tax compared to the rate imposed by surrounding states or foreign countries. A sizable literature of peer-reviewed academic studies supports these observations.[11] A 2017 study published in Public Finance Review provides the academic theory and estimates for how tax rates affect smuggling, highlighting that easily transportable goods (e.g., cigarettes) will be attractive cross-border shopping items.[12] A 2018 study published in the same journal supported those findings by examining littered packs of cigarettes across 132 communities in 38 states, finding that 21 percent of packs did not have proper local stamps.[13]”

In addition to high taxes, the study found that bans on flavored cigarettes in Massachusetts and California have sent smuggling to new heights.

Massachusetts’ ban on flavored tobacco and vaping products moved it up to the No. 3 destination in the country for smuggled cigarettes and helped make New Hampshire the No. 3 state for outbound smuggling.


“The first state to implement a statewide menthol flavor ban was Massachusetts. Its menthol flavor ban took effect in June 2020. In the 12 months following implementation, sales in the Bay State declined by almost 24 percent compared to the 12 months preceding the ban. Through the end of 2021, sales were down more than 25 percent compared to sales from 2019. This decline translates to $135 million less in cigarette tax revenue for Massachusetts (not including lost revenue from sales tax and smokeless tobacco sales).

“Importantly, these sales did not disappear; most of the transactions merely moved to neighboring states or to illicit markets. Throughout most of the US and all the New England states, cigarette sales have constantly declined since the 1960s. It was telling when sales of cigarettes in New Hampshire increased by 22 percent and sales in Rhode Island increased by 18 percent in the 12 months following the Massachusetts menthol ban. Sales in New Hampshire and Rhode Island remain roughly 10 percent higher in 2021 than in 2019 thanks to cross-border Massachusetts shoppers and smugglers.

“Smuggling skyrocketed in Massachusetts. In 2019, prior to the flavor ban, Massachusetts had a net inbound smuggling rate of 19.9 percent, the 12th-highest in the country. The nearly 38 million packs smuggled into the state cost the state more than $133 million per year in forgone revenue.

“A full year after the ban in 2021, smuggling in Massachusetts is up to 37.6 percent, the fourth-highest rate in the country. The 64 million packs smuggled into the state now cost the state $224 million in forgone revenue each year.”

The State of New Hampshire earned $26 million in revenue from cigarette smugglers in 2022, and a total of $955 million from 2007-2022, the report concluded.

Massachusetts’ revenue losses are nearly nine times larger than New Hampshire’s revenue gains.

“In 2019, prior to the flavor ban, Massachusetts had a net inbound smuggling rate of 19.9 percent, the 12th-highest in the country,” the report found. “The nearly 38 million packs smuggled into the state cost the state more than $133 million per year in forgone revenue.

“A full year after the ban in 2021, smuggling in Massachusetts is up to 37.6 percent, the fourth-highest rate in the country. The 64 million packs smuggled into the state now cost the state $224 million in forgone revenue each year.”

The ban has also saddled Massachusetts with enforcement costs.

“Massachusetts has established a dedicated Multi-Agency Illegal Tobacco Task Force, which seized a record-high 18,483 packs of cigarettes in 2022,” the report notes. “This, too, falls dramatically short of the more than 67 million packs smuggled into the state—amounting to 0.027 percent of illegal cigarettes. The scope of the task force also extends to other types of tobacco and vapor devices on a budget of more than $1 million in 2022.”

In addition to creating a market for the smuggling of legal cigarettes domestically, high taxes and flavor bans have created a booming market for illegal, unregulated imports, the report noted, something that has been documented in other studies as well.

In the past, some New Hampshire office-holders have cited cigarette and alcohol smuggling as a reason to raise excise taxes to match those of neighboring states. But this gets the causation backwards.

New Hampshire has always maintained low rates relative to its neighbors. The other Northeastern states created the regional black market by dramatically raising their rates, and in the case of Massachusetts banning menthols.

New Hampshire has been the beneficiary of interstate smuggling, but it was not the cause.


Thanksgiving is a time to count your blessings, and Granite Staters have a cornucopia of them. 

Aside from the obvious charms of the state’s natural beauty, its variety of coastline, lakes, hills and mountains, its plentiful ice cream shops and its abundant maple syrup, humans have created additional benefits of living here.

Below are five man-made reasons to be thankful for calling the “live free or die” state home.

  1. Freedom. New Hampshire ranks No. 1 in overall freedom in the Cato Institute’s Freedom of the 50 States report, last year scoring the highest freedom ranking in the history of the report. It ranks No. 1 in economic freedom in all of North America, topping U.S. and Mexican state and every Canadian province. Though New Hampshire has a high regulatory burden compared with other states, its low taxes and generally restrained government leave Granite Staters freer than any other people in North America. 
  1. Low taxes. Though New Hampshire ranks just 16th in total state and local tax burden according to the Tax Foundation, it is has by far the lowest burden in the Northeast. (Alaska, Wyoming and Tennessee tax their residents the least.) No other New England state is in the top half. Rhode Island ranks 36th, Massachusetts 37th, Maine 41st, Vermont 47th and Connecticut 49th. To find a state with a lower total tax burden, you’d have to drive south all the way to Tennessee or west all the way to Michigan. We can do better, but for our region we pay a lot less in taxes than anyone else.
  1. Government ROI. New Hampshire’s tax structure (no sales tax, no income tax as of next year, keeping many decisions at the local level) forces government to be more frugal. New Hampshire consistently ranks No. 1 in Return on Investment (ROI) for taxpayer spending. That is, we get very high quality services at a relatively low cost. We’re sort of the anti-California in that respect. A DOGE-like review of state spending surely could find some additional efficiencies. But relative to residents of other states, Granite Staters get more for their government dollar.
  1. Earnings. For a remote, rural, cold-weather state tucked up in the Eastern tip of the country, New Hampshire posts impressive personal financial numbers. Whether measured by per-capita or median household income, Granite Staters earn significantly more than our neighbors in Maine and Vermont. The median household income here is $13,500 (16%) higher than in Vermont and $23,000 (30%) higher than in Maine. Massachusetts’ median household income is only $7,700 (8%) higher than ours. New Hampshire also boasts the nation’s lowest poverty rate and the lowest percentage of families living in poverty. Granite Staters also have the lowest median debt in the country, according to Census data. We’re frugal and hard working in both our public and personal lives. “Household income and wealth are essential components of individual well-being,” as the Organization for Economic Cooperation and Development puts it. “The ability to command resources allows people to satisfy basic needs and pursue many other goals that they deem important to their lives.” Granite Staters earn a lot relative to most other states, and we’ve made sure that our government takes very little of it.
  1. Overall well-being. A lot of people believe that high taxes and aggressive government interventions are necessary to creating a high quality of life. New Hampshire proves that wrong. Our low-tax, limited-government state measures high not just on rankings of overall quality of life and places to live, but also in areas such as places to raise a family, child well being, health of women and children, safety and places to find a job. Government does provide basic services and infrastructure, but the culture and habits of the people matter more. Without massive interventions and redistributions, Granite Staters have created wonderful communities.

Capt. John Smith, who named New England, imagined the human promise of the region this way in his 1616 book “A Description of New England:”

“So freely hath God & his Maiesty bestowed those blessings on the ~ that will attempt to obtain them, as here every man may be master and owner of his own labour and land; or the greatest part in a small time. If he have nothing but his hands, he may set up this trade; and by industry quickly grow rich; spending but half that time well, which in England we abuse in idleness, worse or as ill.”

Of all the New England states, New Hampshire most embodies that hopeful vision of a free land where individuals can shape their own lives largely unconstrained by the controlling hands of powerful elites.

We’re not all the way there. But we’re closer than anywhere else in North America. And for that we all should be grateful.