Editor’s note: Since the COVID-19 pandemic, educational entrepreneurship has boomed nationwide. New Hampshire has experienced significant growth in the number of entrepreneurs and innovators willing to take on the daunting challenge of building a new educational ecosystem. This year, we’re highlighting some of the people and organizations that have begun expanding the education marketplace in the Granite State, as well as the obstacles they face in creating nontraditional learning environments.
Our fourth installment explores Wildcat Microschool, a tuition-free Prenda pod in North Haverhill, New Hampshire, that emphasizes the importance of learning outdoors.
As a school counselor in the Newbury, Vt., public school system, Heather Long felt she was just a temporary solution to the many behavioral problems she noticed daily.
“I started to feel like I was a Band-Aid for the problem,” she said. “So, I was being called in to help fix the situation or help kids with these behaviors, and I started to question, ‘Well, maybe the system’s created some of these behaviors?’”
“And I felt like I couldn’t do very much with those kids, and there were too many of these needs for me to get to as a counselor, where I really wanted to be able to change something in that foundation of the system so that these kids could be successful and not have the need for the counselor,” she continued.
Long said she had previously resisted private schools because she wanted to improve the public school system. But she kept hitting too many walls.
With her frustration building, the COVID-19 pandemic hit.
“I just didn’t want [my kids] to be in the public school system with all the changes and the restrictions, especially my kindergartener,” she recalled. “I just couldn’t stand the thought of him being there with everything being so different, and that’s his introduction to school. So, we formed a homeschool co-op with a few other families.”
Long said she quickly noticed that her two kids were flourishing in the new environment.
She could give her oldest a checklist of his tasks that he would finish by the end of the week. But this introduction into self-guided learning was temporary. The co-op disbanded after the initial pandemic response, and the kids returned to their assigned public schools.
“We all kind of went back to our own ways and very quickly realized we weren’t happy,” she said. “I think it was kind of a combination of two things. My kids had the experience—this homeschool, self-paced learning—and really missed it. And for me, it allowed me to start to question school and what school could look like. And I had never allowed myself to question that before.”
Long’s desire to find a system that could adapt more quickly to meet her children’s changing needs led her to Prenda, an Arizona-based company that helps aspiring entrepreneurs start their own microschools.
“Prenda’s mission is to empower learners to take control and ownership over that part of their life,” Kaity Broadbent, Prenda’s chief empowerment advocate, said.
With their affiliate microschools across the country, known as Prenda pods, “Prenda acts as a microschool management platform for the guide to be able to easily offer all of their kids a wide degree of choice,” Broadbent explained.
What Long heard at a Prenda informational session inspired her to do what she hadn’t considered before: Start her own microschool.
“So, I got my wheels turning, like, ‘Well, maybe I could open a Prenda pod.’ When I was at that info session, there was a parent that looked at me, and…she was like, ‘If you do, I will sign up my kid.’”
This was the push she needed.
Before she knew it, Long was interviewing with Prenda, going through its training and background checks, and being approved to start her own Prenda pod.
“There was like a ‘no turning back’ situation for me, and it seemed like what my family needed,” Long said. Out of her own house in North Haverhill, N.H., Long started Wildcat Microschool in December 2021 with four kids. By the end of the school year, she had six learners.
It was hard at first to get families to commit to making this kind of change in their children’s education, Long recalled. Some in her previous workplace even questioned her entrepreneurial endeavor.
“When I first started, especially where I left the public school system, I think there was some animosity towards me and to my co-worker,” she said. “There was some talk around town that wasn’t very positive, but that has quickly shifted because the talk about our school from our families is so positive that it’s shifted the tone really quickly.”
With no government obstacles to slow her transition, Wildcat Microschool grew quickly as a result.
With 16 kids at the start of the following academic year, Long added another full-time guide and a part-time helper. This school year, Wildcat Microschool has 22 learners, all registered as homeschoolers. After starting with four learners and some skepticism about her endeavor, Long now has a wait list.
“I still hear from time to time from people within the system that there are things that are said, but it’s understandable,” Long added. “It’s something different and new, and I think maybe to some of the teachers it feels threatening because they’ve lost kids to us. But we don’t want to be in competition. That’s not our goal.”
What drew so many families to Wildcat Microschool?
“I have some families that come to us because they love the homeschooling idea, they like the microschool idea, they just love what we do,” Long explained. “And other families it’s more of a like, ‘Well, we don’t like what [traditional schools are] doing, so we want an alternative.’”
The 22 learners, including Long’s two sons, are split into two groups, Bobcats (grades K–4) and Pumas (grades 5–8), that alternate between the two guides’ houses during the week. Wildcat Microschool operates Tuesday–Friday from 8 a.m. to 2 p.m.
While Long hopes to make her homeschool learning center a vendor of Education Freedom Accounts next year, her 22 learners are tuition-free this academic year thanks to Prenda’s Bright Futures Grant, which funds Wildcat Microschool.
Not all Prenda pods are the same, so learner experiences across New Hampshire and the country vary. Prenda supports its affiliates but grants them the flexibility to provide a variety of educational environments.
“To speak to flexibility, that’s their microschool, and they’re choosing to partner with Prenda to provide services to parents and kids who are their customers, so we try to really stay out of the middle of that relationship and allow each guide to present themselves as they wish,” Prenda’s Broadbent explained. “The worst thing we could do at this point in the history of education is create another one-size-fits-all solution. Prenda is an education solution that is inherently built for flexibility and personalization from the guide side and from the student side, especially.”
Wildcat Microschool shares several of the characteristics common among unconventional learning models—an emphasis on hands-on, project-based learning, allowing free play, and maximizing learner agency—while also having other more distinct focuses in their everyday practice.
“We found that kids really thrive off of purpose…. So, we do a lot of projects with a purpose at the end,” Long explained. “Our ‘readers cafe’ is an example where they’re going to read their stories out loud to everybody and have this cafe, that’s the purpose. Last year, we did biography projects, where they did a ‘living wax museum.’ So, we find that we always have something we’re striving for for a purpose for the kids, and that helps with engagement.”
By ensuring that everything they do has a purpose, Long’s learners are invested in their own educational journeys, more easily retaining the core lessons of each hands-on project because there’s a goal at the end that they’re working towards.
A focus on financial literacy
Wildcat Microschool sets itself apart from other options in two ways. One is the attention paid to financial literacy.
“We were doing economics [last year], and the kids were doing their own business projects,” Long said. “So, we did like a ‘Shark Tank’ project. They had to come up with their own business idea, and they did the marketing, they did a business pitch…. And when we ended that, I just felt like, ‘I don’t think we quite got to the financial piece as much as I wanted.’ Like, I wanted them to get more out of it, which is one of the beauties of what we do. Instead of being like, ‘Nope, I’ve got to move on to this next unit next year,’ [we] decided to start off with it again.”
This includes going through lessons about finances, keeping a budget, banking and loans, investing, the stock market, and taxes, with the help of the popular The Game of Life. “So, we learned about taxes,” Long said. “They got to choose their career, which, of course, they all chose the top-paying careers they could find, and then very quickly realized if you pick a top-paying career you’re going to get more taxes pulled out of it. So, we had a conversation about taxes, which will bring up conversations about government and how our government works.”
Emphasizing financial literacy as part of the curriculum gives these children in kindergarten through eighth grade an education that they might not get at their assigned public schools at that age, as well as the life skills that come with it.
The forest for a classroom
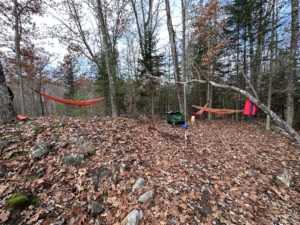
The other distinguishing feature of Wildcat Microschool, made possible by its location in the White Mountain National Forest, is the forest classroom.
“We’re really big on outdoors and getting the kids outdoors,” Long emphasized.
Every Friday afternoon, alternating each week between the two age groups, Long takes the learners on a five-minute walk into the woods behind her house to the learning pod’s forest classroom, a roughly 1,000-square-foot space in the woods complete with supplies, hammocks, a fire pit, and forts.
Here, the kids have a lot of freedom (by design), and they learn how to interact with each other and collaborate. They learn fire-starting skills (with supervision), eat lunch, practice writing in their journals, and play games as part of their overall nature-based education.
“Number one, we’re using our local resources, right?” Long responded when asked about the benefits of outdoor learning. “Like, we live in a place where there’s tons of nature. So, teaching the kids about that and respecting that, helping them love it, because I think to be healthy and to kind of thrive around here, especially in the winter time, we have to be able to get ourselves outside all the time. So, there’s that mental health component. I think being good stewards of the environment—like, if we want kids to really respect our environment and protect it in the future, we have to get them to be out there and explore it and love it.”
Moreover, the forest classroom allows Wildcat Microschool to incorporate some risk-taking and survival skills, building confidence and agency in the learners, she said.
“One of our youngest…has wanted to start a fire…. So, we were working with him on it a few weeks ago, and he finally got it. And it was so cool, he just jumped up with his hands. We have a picture of the moment. So, for him, just thinking about that, the confidence, like, ‘Hey, I did this by myself’—when we talk about autonomy, there are a lot of opportunities we can give them out in nature that allow them to have that autonomy.”
Outside in the forest classroom, Long told us, “It’ll be very interesting to see where all these kids are in 10 to 15 years. I have no doubt that they’ll be very successful people.”
Measuring success
How microschools measure success and provide accountability to parents are questions often brought up by skeptics. Long has ready answers.
“Number one is our retention,” she said. “We’re accountable to our parents and our families, and the fact that all of our kids want to come back and our families want their kids here says a lot about what we’re doing.”
Long points out that all but one learner returned to Wildcat Microschool for this school year. The child who didn’t return had moved.
Wildcat Microschool also administers tests, so it has those scores to measure student progress. But that’s just one piece of the puzzle for Long.
“I, more than anything, want to see kids that are independent learners, that love learning, that are able to critically think and problem solve, and those are really hard things to measure.”
Long added that one of her frustrations with the public school system was the limited amount of parent involvement. Facilitating that involvement has been a guiding principle behind the philosophy of Wildcat Microschool.
“I feel very strongly that it’s a parent’s job to educate their child,” Long said. “And whether or not they choose to entrust someone else to do that, that’s fine, but they have to work closely with that other person. And I think it’s the parent’s job to decide what those goals are and what that education outcome should look like.”
Long is proud to have created an educational institution directly accountable to parents. In her view, working closely with parents and their children to create a responsive, family-driven educational experience is the key to Wildcat Microschool’s success.
Wildcat Microschool in North Haverhill can be found online at https://wildcatmicroschool.weebly.com/.