New Hampshire’s median home price hit an unprecedented half-million dollars in March, just two years after passing $400,000 for the first time, underscoring the urgency of making changes to local land-use regulations.
The change represents “a 16 percent drop in affordability from a year ago,” according to the New Hampshire Association of Realtors (NHAR) report.
For context, the state housing affordability index was 59 in March. In other words, the median household income in New Hampshire ($90,845) is a mere 59% of what one needs to qualify for the median-priced home at current interest rates.
Such poor affordability prospects haven’t always plagued Granite Staters. According to NHAR, the affordability index hit upwards of 150 in March 2017 and even reached a high of 200 in 2013.
The culprit, as the NHAR concluded (and many Granite Staters know by now), is a “lack of New Hampshire housing inventory….”
NHAR President Joanie McIntire emphasized the point.
“The problem remains the shortage of available housing that is continuing to make homeownership more difficult than ever for those workers needed to help an economy thrive,” she said.
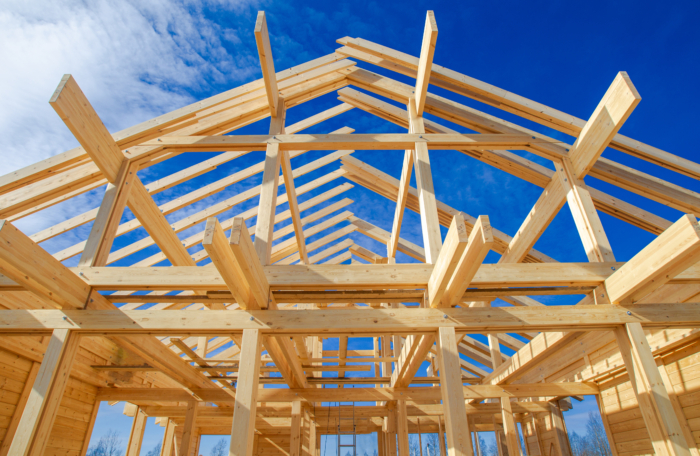
There is no doubt that New Hampshire’s supply of homes is nowhere close to meeting residents’ demand for homes. In a functioning market, when prices signal such huge demand builders would be expected to increase supply rapidly.
New Hampshire unfortunately doesn’t have a functioning market thanks to a thick layer of local government regulations.
Exclusionary zoning—the use of zoning ordinances to exclude certain types of land uses from zoning districts—has run rampant in New Hampshire municipalities for decades, choking the supply of housing throughout the state.
Since our 2021 study identifying zoning as a major cause of the state’s housing shortage, there’s been a growing consensus that the current land-use landscape in the Granite State has to change.
As if to emphasize our analysis of the New Hampshire market, the Fall/Winter 2023 edition of the Journal of Housing and Community Development last December published this summary of the link between restrictive zoning and housing affordability:
Restrictive zoning codes contribute to socioeconomic divisions, worsen the housing affordability crisis, and artificially inflate housing prices. The insufficient housing supply further emphasizes the importance of exploring opportunities for increasing housing stock through land use reform.
The correlation between states’ median home prices and their land-use freedom is particularly damning. Among the 25 states with the lowest median home prices, according to Redfin and Bankrate 2023 data, 20 of them also rank in the top 25 for most land-use freedom, according to the Cato Institute’s Freedom in the 50 States 2023.
Conversely, of the 25 states with the highest median home prices, 20 of them are found in the bottom 25 for the least amount of land-use freedom.
In these rankings, New Hampshire has the 14th-highest median home price and is the 12th-most restrictive state when it comes to land-use freedom.
The relationship, reflected in numerous studies, is clear: Less land-use freedom shrinks the supply of housing, which leads to inflated home prices.
Another way to look at the problem is through building permits. New Hampshire publishes building permit approvals collected by the U.S. Census Bureau. These data show a sharp and sustained reduction in building permit approvals since the early 1980s, showing that the housing supply problem long predates the pandemic or the 2007–08 recession.
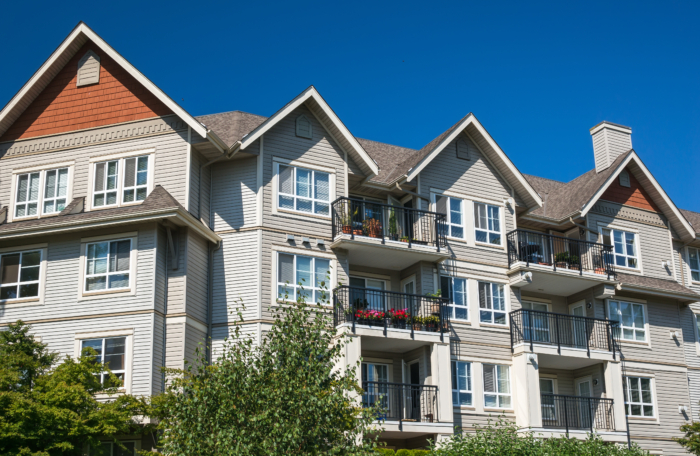
From 1984–1988, more than 10,000 residential building permits (single-family and multifamily) were issued per year in the state, with the peak being 18,015 in 1986. The last time more than 5,000 residential building permits were issued in a single year was 2006—18 years ago.
The median home price in New Hampshire cracked $200,000 for the first time in 2002. For the next two decades, home construction did not come close to meeting demand. By 2021, the median home price had doubled to $400,000. Now it’s $500,000. Despite astronomical demand for new homes, the number of residential building permits issued in 2023 was just 4,512, a decline of 271 from the year before.
Builders make money by building and selling homes and apartments. They want to meet this demand. Too many local governments have made it too costly or difficult for them to do so.
At this point it’s clear that relaxing local restrictions on land-use freedom in New Hampshire is critical to opening the market forces that will allow supply to meet demand. The more urgently policymakers act to lift regulatory obstacles to home construction, the more quickly builders will be able to respond to these flashing-red market signals and provide Granite Staters the housing they so desperately want.