In the last decade, ridership on Manchester Transit Authority (MTA) buses fell by 38.6%, yet city taxpayer spending on the MTA increased by 38.2% above the rate of inflation, an analysis by the Josiah Bartlett Center for Public Policy shows.
As Mayor Jay Ruais and city aldermen search for savings in a stressed city budget, the MTA offers an agency that could be scrutinized for possible spending reductions.
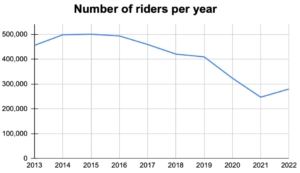
From 2013–2022, data from the MTA reported to the Federal Transit Administration show that city bus ridership peaked in 2015 at 500,575.
Ridership fell each subsequent year, with the exception of 2021–2022, to 279,948 in 2022—a drop of 44.1% in just seven years. While this includes a steep 13.5% decline during the pandemic (2020–2022), the drop of 18.2% before the pandemic (2015–2019) was even larger. The decline over the entire decade was 38.6%.
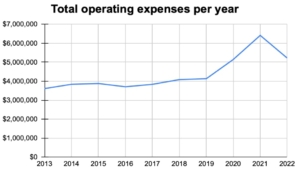
While ridership fell, the amount of money spent on Manchester public transportation only increased. From 2013–2022, MTA’s total operating expenses rose from $3,613,280 in 2013 to $5,219,813 in 2022, an increase of more than $1.6 million, or 44.5%, in nominal dollars. After adjusting for inflation,* the increase is still $940,802, or 22%.
(*The inflation calculation uses Personal Consumption Expenditure (PCE) Indices from January 2013 and January 2022.)
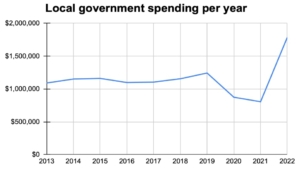
This steep rise in spending includes a 62.4% increase, or a 37.1% inflation-adjusted increase, in funds from the federal government and a 63.6% increase, or a 38.2% inflation-adjusted increase, in local government spending.
Meanwhile, Manchester public transportation has become less profitable, as fare revenues have dropped 23.9% since 2013.
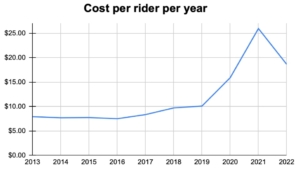
In 2013, MTA’s cost per rider was $7.93. The lowest point it reached was $7.51 in 2016. Since then, the cost per rider has skyrocketed, hitting a peak of $25.96 in 2021 before falling to $18.65 in 2022, still more than $10 more per rider than a decade earlier. All told, the last 10 years saw a jump of 135.1% in Manchester’s cost per rider.
The huge increase in costs per rider was not just a matter of falling passenger numbers. As ridership fell during the past decade, the MTA aggressively increased service.
Since 2013, MTA’s total miles driven have increased by 52.3%, going from 536,627 total miles in 2013 to 817,081 in 2022. Total hours driven have seen a similar increase as well, jumping 59.3% from 46,159 total hours in 2013 to 73,521 total hours in 2022.
The MTA’s service area population and total square miles covered have expanded too.
From 2013–2019, MTA served 135,366 residents and covered 63 square miles. Since the 2020 census, MTA has been serving 248,263 residents and covering 235 square miles, increases of 83.4% and 273%, respectively.
The official 2023 MTA ridership and expenditure numbers won’t be publicly available until later this year. Although the city has figures showing 328,976 riders and $5,420,475 in total operating expenses for FY 2023 (cost per rider of $16.48), that time frame of measurement is different from what the Federal Transit Administration uses. Therefore, an apples-to-apples comparison can’t be made now between 2013 and 2023. The 2023 numbers won’t be added to this database until the official figures are released.
The MTA plans to return to upwards of 400,000 annual passengers. But the current numbers and trends show a public service that yields a poor return on taxpayer spending.
And the poor financial picture is not due solely to the COVID-19 pandemic, as the problems began years earlier. The pre-pandemic years of 2013–2019 saw MTA ridership plummet too.
The numbers strongly suggest that MTA is hauling more taxpayer dollars than what is required for public transportation in the region. City leaders could find some budget savings by paring back MTA services to pre-pandemic levels, eliminating or curtailing underused routes, and seeking ways to enhance revenues.


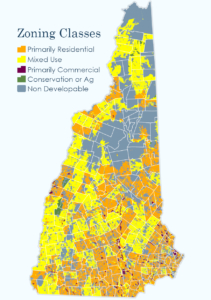 The New Hampshire Zoning Atlas is the most powerful tool Granite Staters have ever had for understanding local zoning ordinances. It catalogues—and maps—23,000 pages of zoning regulations in 2,139 districts in 269 jurisdictions. Never has this information been available in one place, much less open for public examination.