This week, New Hampshire’s initial unemployment claims fell below 2,000 for the first time since March. And the state’s positive PCR coronavirus test rate edged up past 1% for the first time since the state started increasing its testing and calculating the percent-positive rate late this summer. Whether the state can keep the former trend going depends on how the latter is handled.
It’s hard to overstate the importance of keeping the economy from sliding back into a recession. Contrary to the sentiments of delusional anti-capitalists who blithely assert that the economy can be sacrificed indefinitely for the purpose of crushing the virus, a thriving economy is a tremendous social good and ought to be a top governmental priority.
When profits evaporate, so do jobs. When jobs evaporate, people suffer, especially those in the most vulnerable financial positions.
As the National Institutes of Health has documented, people who lose their jobs suffer from higher stress and more medical ailments. As the Urban Institute documented after the last great recession:
“Being out of work for six months or more is associated with lower well-being among the long- term unemployed, their families, and their communities. Each week out of work means more lost income. The long-term unemployed also tend to earn less once they find new jobs. They tend to be in poorer health and have children with worse academic performance than similar workers who avoided unemployment. Communities with a higher share of long-term unemployed workers also tend to have higher rates of crime and violence.”
Before the coronavirus hit New Hampshire, weekly unemployment claims were consistently below 1,000 per week. The state’s economy was an employment machine, allowing Granite Staters, both blue and white collar, to enjoy the dignity of work and self-sufficiency.
The lockdown caused unemployment claims to spike from 642 to 29,379 in a single week. Claims surpassed 30,000 for the next two weeks before starting to decline in April. As the economy slowly opened, unemployment claims fell and are now just under triple their pre-pandemic level (1,880 this week vs. 642 the week of March 14).
Some economic sectors remain in dire circumstances (think hospitality), but the economy as a whole has clawed its way back throughout the summer and is well positioned to continue growing. Locking down the economy again would be an economic and humanitarian disaster.
In the second quarter, New Hampshire’s GDP declined by 36.9%. Another economic hit even close to that would devastate not just the state’s employers, but its non-profits, local governments, and the state budget.
Businesses make the economy run, and the economy includes non-profits and government. Business profits make it possible for people to pay their mortgages and grocery bills, but also to pay their property taxes, donate to non-profits and churches, and generate the revenue that keeps schools open, roads maintained, and social services funded.
Business taxes make up the largest single source of revenue for the state budget, accounting for $805.6 million of the state’s $2.6 billion in general and education fund revenue in 2019. The next-largest source, excluding property taxes retained locally, is the rooms and meals tax at $350.1 million. And of course strong rooms and meals tax revenue depends on a healthy hospitality industry.
Other major taxes — the interest and dividends tax, the insurance tax, the communications tax, the tobacco tax — all depend on businesses to be successful and profitable. Even state liquor sales are business-dependent. The state doesn’t make liquor. It sells liquor and wine made by the private sector.
Keeping the economy from collapsing again is mission critical for New Hampshire’s employers and for state and local governments. That’s why the governor’s order this week requiring restaurants to collect contact information from patrons was an encouraging sign.
After several COVID-19 clusters associated with restaurants, the governor could have ordered restaurants closed, as some European countries are doing. Instead, at the request of the New Hampshire Restaurant Association, the governor ordered contact tracing.
The goal of the order is two-fold. One, it reduces, if not ends, the state alerts that ask people who patronized a cluster-associated restaurant to come forward. Those alerts cause alarm and discourage people from going out to eat. They hurt all restaurants, which hurts the entire industry, making it more likely that struggling restaurants will close permanently. They also hurt the state budget by reducing rooms and meals tax revenue.
Two, the order allows for quicker contact tracing, which can curtail the spread of the virus, helping to avoid other clusters or outbreaks. That, in turn, helps keep the broader economy open.
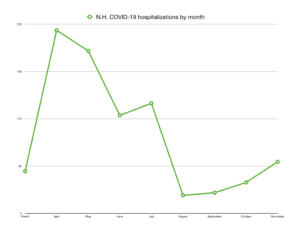
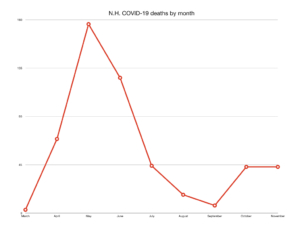
COVID-19 infections, hospitalizations and deaths are expected to continue rising this fall and winter. The state’s response must not be a broad economic shutdown. They are devastating, and if Europe is an indication they are likely to be ineffective as people revolt against their restrictions. If another lockdown is to be avoided, the state and the people have to focus on suppressing clusters and outbreaks.
The state can do only so much if people don’t take responsibility for their own behavior. As with most any other government intrusion in the name of public health, safety or welfare, if individuals decide to do their share, there will be less for the government to do on their behalf.