Granite Staters entering the job market often face government-imposed barriers to entry. State-required licenses can come with onerous fees, arduous training requirements and a lack of reciprocity for individuals already licensed by another state in their field of practice.

Gov. Chris Sununu has proposed a major overhaul of New Hampshire’s occupational licensing bureaucracy. The governor’s proposal would establish universal license reciprocity, streamline the license approval process, consolidate licensing boards and eliminate 11 of them, and eliminate 23 permanent and 11 temporary licenses.

How would changing the state’s licensing bureaucracy and eliminating nearly two dozen licenses affect New Hampshire consumers?

Join us at Stark Brewing in Manchester on Tuesday, April 11, for a drink and a discussion to learn how unnecessary licensing regulations make it harder for Granite Staters to achieve the American Dream and how New Hampshire can work to break down these barriers.

Panelists are:

Drew Cline, Josiah Barlett Center for Public Policy

Ross Connolly, Americans for Prosperity

Jessica Poitras, Institute for Justice


Time & Location: 6-8 pm, Stark Brewery, Manchester, N.H.


AFP-NH is generously providing one drink ticket per attendee

Dinner will be provided.

RSVP Required (REGISTER HERE)

The big story of the 2024-25 state budget has lurked just below the surface of most media coverage. It’s not the $99.6 million in employee pay raises, the increase in adequate education aid or the shifting of some Education Trust Fund line items to the General Fund. 

The big story is that lawmakers and the governor have incorporated at least $850 million in new revenues into the budget — and spent it. 

For the last decade, state revenues have exceeded projections in every fiscal year except for the pandemic year of 2020. Gov. Chris Sununu and legislative leaders have tended to categorize most of these annual surpluses as happy accidents (“one-time money”) rather than permanent funds to be counted on for future budgets.

That has changed. 

Legislative leaders and the governor this year incorporated the higher revenues into future revenue projections, and into the budget. 

The governor’s 2024-2025 budget projects revenues that are $912 million higher than those in the 2022-2023 budget. The House Finance Committee projects revenues $850 million above the previous budget. 

In Fiscal Year 2022, revenues were $435 million above budget. So far in Fiscal Year 2023 (through March), they are $323.7 million above budget. Lawmakers made quite conservative revenue estimates for the 2022-2023 budget. When the large surpluses materialized, most of the money found its way into appropriations.

Based on actual spending levels, then, the final 2024-2025 budget might not be that much bigger than the one before it. But measuring from one official budget to the next, the increase is very large. In practice, the main difference between the two budgets is the increase in baseline revenue assumptions, which are then used to fund ongoing spending. 

The question is not whether budget writers should accept, with caution, a higher baseline budget. It’s whether to spend that money or cut taxes. The follow-up question is how to prioritize those dollars if spending is the chosen option. 

Both the governor’s proposal and the House Finance Committee budget opt primarily for spending, though both contain some additional tax relief.

There are clear inflation-related reasons to raise state spending in some areas. The Department of Administrative Services notes, for example, that since 2018, state employee cost of living raises have totaled 5.4% while inflation has totaled 20.7%. With large vacancy rates in many departments (51% for entry-level positions at the Department of Corrections, according to the department), the market is sending a signal that state employee pay is too low. 

The state’s rates for medical providers who offer services through Medicaid also have been eroded by inflation, as has state adequate education aid. 

But both budget proposals raise General Fund and Education Trust Fund spending (money that comes from state taxes) above the rate of inflation.

The governor’s budget increases General Fund and Education Trust Fund spending by $889 million over the biennium, or 16.6%. General and Education Trust Fund spending under the governor’s plan totals $6.285 billion.

The House Finance Committee budget increases General Fund and Education Trust Fund spending by $981.4 million, or 18%. General Fund and Education Trust Fund spending under the House Finance Committee budget totals $6.37 billion. (Again, those represent increases from the approved 2022-2023 budget, rather than from actual appropriations.)

House Finance Committee Chairman Ken Weyler said during a budget presentation on Tuesday that the committee strives to keep spending below the combination of the inflation rate and population growth, which is best practice. The current budget, he acknowledged, exceeds that combined growth.  

The House Finance Committee used an inflation rate of 12.7% and a population growth rate of 1.5% to reach an optimal maximum budget growth rate of 14.2%, Weyler said. 

Had the committee kept spending to that level, the growth would be approximately $765 million. Instead, the committee proposes increasing spending by $981.4 million, which is $216.4 million above the combined inflation and population growth rate. 

The final percentage increase over the current state budget remains subject to negotiation. But the big takeaway is that a decade-long growth in state revenues plus a huge inflation spike have combined to ratchet state General Fund and Education Trust Fund spending to a level in excess of $3 billion a year. 

Going forward, this will be considered the new normal. Experience suggests that once a new baseline budget level is reached, returning below that level is extraordinarily difficult. 

“Very heavy taxes, are hurtful, because they lessen the increase of population by making the means of subsistence, more difficult.”

— John Adams, 1780

Last November, Massachusetts voters approved a so-called “millionaire’s tax.” It raises the state income tax from 5% to 9% for incomes of $1 million or more, an 80% tax increase. 

Four months later, the Massachusetts Society of Certified Public Accountants is sounding an alarm.

After surveying 270 member CPAs, the society in March released a paper titled “Massachusetts is Losing Residents and it’s Getting Worse: Can Tax Policy Changes Mitigate Outmigration?”

The survey of Massachusetts certified public accountants found that:

  • 82% of CPAs surveyed indicated that their high-income clients have expressed plans to leave Massachusetts in the next 12 months. Florida and New Hampshire are overwhelmingly the most popular choices for relocation. While some may argue that a move to Florida is driven by a desire for better weather and a different lifestyle, the fact that the second most popular destination is New Hampshire suggests that people want to stay in the area but may be motivated instead by a lower cost of living, including a lower tax burden. Furthermore, New Hampshire is set to repeal its Interest and Dividends Tax by 2026, which would make a decision to relocate even more appealing.

  • 61% of respondents indicated that tax policy is the primary reason their clients are considering leaving the Commonwealth in the next 12 months. 

  • An additional 39% of CPAs indicated that tax policy is a consideration for relocation. 

  • 0% of respondents indicated that tax policy is not a factor in the decision for high-income taxpayers to relocate.

  • More pointedly, half of CPAs said that the new Millionaire’s Tax specifically is the primary reason their clients are considering a move in the next 12 months.

“Some may have been willing to bear Massachusetts’ tax policy in the past, but moving from a five to nine percent income tax rate is an unprecedented 80% rate increase,” the report concluded. “That will undoubtedly inspire affected Massachusetts residents to reconsider their primary residence.”

New Hampshire Business Review reached a similar conclusion after interviewing New Hampshire real estate agents.

Outliers

The Massachusetts CPAs call Massachusetts an “outlier” in the region for its extremely high tax rates and complex tax code. 

“Being an outlier makes it more difficult for the Commonwealth to compete with its regional neighbors and on the national landscape when it comes to attracting jobs, residents and capital investment, but it also violates basic tax principles of neutrality and economic efficiency,” the CPAs wrote.

“The current tax code introduces complexity and incentivizes opportunities to use a domicile change as a tax planning tool, which creates a host of unintended consequences for the state. Before the Millionaire’s Tax Massachusetts maintained a competitive edge in our region with the relatively low, flat individual income tax rate, which helped mitigate other issues such as the uniquely burdensome short-term capital gains tax rate and estate tax. Unfortunately, that is no longer the case.”

Those are words New Hampshire policy makers should always remember. 

New Hampshire is an outlier too, in the other direction. Our lower tax burden has helped to make our state the economic envy of the region, a continental marvel and a haven for tax refugees.

New Hampshire ranks 47th in state tax collections per capita, just a hair worse than Florida, according to a Tax Foundation ranking released this month. 

How do the other New England states fare? They’re all in the top 20. 

Vermont is No. 1, Connecticut 3, Massachusetts 7, Maine 15, and Rhode Island 16. 

New Hampshire collects very little tax revenue per person, compared to our neighbors, and yet we have the region’s lowest poverty rate and a booming economy. And we’re stealing population from the high-tax jurisdictions around us. Funny how that works. 

WalletHub, in an analysis also released this month, ranked New Hampshire 48th (third best) in tax burden. Maine and Vermont ranked in the top five, and the rest of the New England states were in the top 20. 

Migration patterns don’t precisely align with tax burden rankings because people aren’t 100% economically motivated, but there’s a tremendous amount of overlap. In 2022, Americans did tend to move from high-tax to low-tax states, as usual, according to several different data sets, including the Census’ own. 

The top in-migration states in 2022 were low-tax Florida, Texas, North Carolina, South Carolina and Tennessee, while the top out-migration states were high-tax California, New York, Illinois, New Jersey and Massachusetts, according to the list compiled by the National Association of Realtors.

Just-released Census data show that six of the top ten counties in the United States for population growth from July 2021-July 2022 were in Texas. The counties that lost the most people were Los Angeles County and Cook County, Illinois, Axios reported. 

The Massachusetts CPAs note in their report that a huge tax rate increase on people who are most able to move, passed right as the rise of remote work has made people less tied to their location, is a recipe for exodus. 

Likewise, a big tax rate cut on the same people, at the same time, would be a strong attraction. Strategically, this year would be the perfect time to accelerate the phase out of New Hampshire’s Interest & Dividends tax. 

Scheduled to phase out over the next four years, the tax remains for now a signal to high-wealth individuals that Florida would be a better relocation destination. 

Like any number of high Massachusetts taxes, the I&D tax is a disadvantage. It weakens New Hampshire’s competitive position and serves as a disincentive to move, or stay, here. 

It’s currently on schedule to be phased out by 2027. The House Finance Committee has recommended moving that date to 2025. Were the state to do that, or nix the tax entirely this year, it would not be lost on high-income individuals, retirees and anyone else with income from interests or dividends that New Hampshire’s tax burden is falling as Massachusetts’ is rising. 

New Hampshire is not listed among the seven states that truly have no income tax. Eliminating the I&D tax would put us on that list and make New Hampshire an even more attractive destination. 

Some might say that we don’t have to make ourselves more competitive if Massachusetts is making itself less competitive. But state tax competition is no longer just regional. 

The rise of remote work makes it even easier for people to shop for a low-tax place to live, regardless of where their employer is located. And the world’s increasing wealth makes it easier than ever for investors, entrepreneurs, retirees and others to move to favorable jurisdictions. 

The Massachusetts CPAs point out that when high-income residents leave Massachusetts, they take their community involvement and charitable giving with them. Making New Hampshire more attractive to these increasingly mobile people benefits not just New Hampshire’s economy, but our communities too. 

While Massachusetts is pushing higher-income residents out, New Hampshire has an opportunity to turn their attention away from Florida and toward the Granite State. 

As Gov. Chris Sununu moves to undo the state’s overly burdensome occupational licensing regime, legislators are trying to add more licenses. 

On Wednesday, March 22, the House voted 210-166 to require a state license for the practice of music therapy. 

Why? Health insurance.

Supporters said New Hampshire needs to license music therapists to ensure that patients can be reimbursed by their health insurer when they purchase music therapy treatment. 

It’s not that music therapists don’t practice — and practice safely — in New Hampshire. They do. It’s purely a matter of insurer reimbursement.

But as Rep. Carol McGuire, R-Epsom, pointed out, that’s hardly a reason to create an entire licensing bureaucracy for one therapeutic specialty. 

“…it is not the best use of our time and our state resources to create a separate statute, a separate license, a separate registration board, separate rules for each tiny specialization in the therapy field,” McGuire said.

House Minority Leader Matt Wilhelm, D-Manchester, argued that licensing music therapists would increase the supply of music therapists.

“New Hampshire is in the middle of a mental health crisis and the need for therapists is an urgent need,” he said.  People who need this type of therapy “could benefit from additional therapists.”

“…if there were certified music therapists and licensed music therapists,” he said, “it would increase the amount of people that would have access to care and high-quality care….”

But research on occupational licensing finds that licensing requirements tend to reduce the supply of practitioners and drive up prices. 

Only nine states license music therapists, according to the Certification Board for Music Therapists, a national organization that promotes excellence in music therapy.

If House Bill 532 becomes law, New Hampshire would be the only New England state to require a license to practice music therapy. Rhode Island registers, but does not license, music therapists, and Connecticut requires certification, but not a license, for anyone who uses the title “music therapist.” 

National certification through a respected trade organization offers a simple method for consumers to seek outside expert verification of music therapist credentials. 

In fact, supporters did not even make a health or safety argument for the license. There were vague references to “quality” therapists, but no one argued that the public is in danger from unlicensed music therapists, or that consumers are incapable of checking a therapist’s degrees or other credentials. 

In his budget, Gov. Sununu proposed a thorough restructuring of the state’s occupational licensing bureaucracy, complete with a consolidation of numerous boards and the elimination of 21 permanent licenses and 13 temporary licenses.

Other states are moving in this same direction. There’s a growing movement nationwide to remove unnecessary barriers to economic opportunity, particularly after the COVID-19 pandemic exposed just how economically damaging so many licensing restrictions are. 

Creating an additional licensing bureaucracy for a single niche field — when no health or safety reason has been identified — would move New Hampshire in the opposite direction. 

If health insurance reimbursement is the issue legislators want to address, then they could do so through insurance laws.


Editor’s note: Do you like the painting used to illustrate this piece? It’s the first AI-generated art we’ve used to illustrate an essay. We asked for a woman listening to music in a therapist’s office. Not bad. And no artist’s license was required.

A surefire way to suppress already low levels of youth employment is to raise the cost of employing younger workers. Some proposals in the Legislature would do that, in the name of helping these same workers. 

One proposal, House Bill 125, would make it illegal to employ 16-and 17-year-olds after 9 p.m. Sunday-Thursday and after midnight Friday and Saturday during the school year. 

Were this to become law, employers would be subject to fines of up to $2,500 each time a high school student clocks out a minute late. (These fines are seldom imposed, according to the state.)

State law currently caps at 35 the number of hours older teens can work during a five-day school week. HB 125 was intended to fix an oversight in a previous revision of youth employment law that inadvertently let teens ages 16 and 17 work up to 48 hours during shortened school weeks. But this particular attempt at a fix would inevitably trigger unintentional violations of state child labor laws. 

The predictable effect of such a law would be to discourage the hiring of high school students, and to reduce the hours of those who are hired. 

New Hampshire already limits youth under the age of 16 to working between 7 a.m. and 9 p.m. Adding a 9 p.m. curfew for older teens would further depress employment in this age group. Teen employment was declining sharply before the pandemic and fell again in 2020. It has not recovered to pre-pandemic levels. 

With a precise time limit on the books, employers would be in violation of state labor law every time a teen doesn’t punch out on time. To avoid being written up for labor law violations whenever a teen gets distracted at the end of his or her shift, employers would end shifts earlier, hire fewer teens, or both. 

As if intended to depress youth employment even further, House Bill 58 would raise the wage for tipped jobs to a minimum of $7.25 an hour. Currently, New Hampshire employers may pay wages as low as $3.26 an hour to employees who earn tips.

HB 58 would set the regular federal minimum as the floor for all jobs, even those with substantial tip income. Were this to become law, restaurants would have to pay all servers an additional $3.99 per hour. The negative effect on employment would be immediate and predictable. 

A University of California-Irvine study published last August found that raising the tipped minimum wage reduced employment. 

“(O)ur evidence is quite clear and unambiguous in pointing to higher tipped minimum wages (smaller tip credits) reducing jobs among tipped restaurant workers, without enough of an increase in earnings of those who remain employed to offset the job loss,” the authors found.

Other research has found that higher minimum wages reduced teen employment, and that “teens exposed to higher minimum wages since 2000 had acquired fewer skills in adulthood.” 

Well-intentioned regulations such as those in HB 58 and HB 125 would end up worsening New Hampshire’s existing labor shortage and hurting the very people they are intended to help. 

In 2019, the U.S. Bureau of Labor Statistics recorded 67,000 employed Granite Staters between the ages of 20-24. In 2022, that number was down to 52,000. 

In 2019, the state estimated the number of waiters and waitresses in New Hampshire at 12,390. In last year’s report, it was down to 7,260, a decline of 41%, even though the entry-level wage was $1 per hour higher. 

Restaurants, already pressed by rising supply, labor and energy costs, have been raising prices to maintain their meager margins. Add in a state mandate to more than double base pay for wait staff, and some restaurants certainly will be forced out of business. Others will raise prices even further. Restaurant prices rose 8.2% from January of 2022 to January of 2023, according to the National Restaurant Association. That’s higher than overall consumer prices, which rose 6.4%.  

According to surveys of New Hampshire Lodging and Restaurant Association members, servers in New Hampshire earn between $20-$45 an hour when tips are included. Granite Staters do tip generously, ranking fifth nationally and first in New England, according to Toast, a Boston company that provides software for point-of-service tablets used by the restaurant industry.

As New Hampshire employers struggle with a labor shortage, persistent inflation and predictions of a looming recession, artificially increasing the cost of employing younger and lower-skilled workers would add an additional burden. As that burden would be tied to the hiring of those workers, it would likely lead to reduced opportunities for them. 

Hurting both employers and younger workers is not the intent of such regulations, but it would be the predicted outcome.  

“Healthy market competition is fundamental to a well-functioning U.S. economy. Basic economic theory demonstrates that when firms have to compete for customers, it leads to lower prices, higher quality goods and services, greater variety, and more innovation.”

— Heather Boushey and Helen Knudsen, “The Importance of Competition for the American Economy,” The White House, July 9, 2021

Competition has been central to American life from the beginning. It’s at the core of the American identity. As the Biden administration has stated (in the quote above), competition has proven its public value by stimulating the innovation that improves quality and lowers prices. 

Libraries full of economic research bear this out. As a paper for the Organization for Economic Cooperation and Development put it in 2002: “Competition has pervasive and long-lasting effects on economic performance by affecting economic actors’ incentive structure, by encouraging their innovative activities, and by selecting more efficient ones from less efficient ones over time.”

This applies to all industries, including education. School choice is expanding in state after state because the data show that it works. And it works not just for students who enroll in alternative programs but for those whose families choose traditional public schools as well.

“We find evidence that as public schools are more exposed to private school choice, their students experience increasing benefits as the program scales up,” a 2020 study of Florida’s tax credit scholarships found. “In particular, higher levels of private school choice exposure are associated with lower rates of suspensions and absences, and with higher standardized test scores in reading and in math.”

That’s not a fluke. 

Of 28 studies that have examined the competitive effects of various school choice programs on students who remain in traditional public schools, two found negative effects, one could find no effect, and 25 found positive effects, as EdChoice details in its compilation of school choice studies titled The 123s of School Choice. 

What about educational outcomes, such as graduating from high school or college? No study has found a negative effect, and most have found positive effects. 

For example, a 2019 Urban Institute study of Florida’s tax credit scholarship program, the nation’s largest private school choice program, found that it generated a 12% increase in college attendance.  

The vast majority of research on school choice finds that the introduction of a choice program tends to improve test scores, educational outcomes, parental satisfaction, integration, and civic values and practices — while saving money. 

The financial effects have been studied the most, and their findings aren’t surprising. Of 73 studies of the fiscal effects of school choice programs, five found a net cost increase, four found cost neutrality, and 68 found that the introduction of choice generated cost savings. 

School choice works because the competitive forces unlocked by the creation of a robust marketplace generate the same positive effects in education that they do in other industries. 

“Students attending schools with more competitive pressure made larger gains as program enrollment grew statewide than did students at schools with less market competition,” the authors of the 2020 Florida study wrote.

Because competition has been proven to generate positive outcomes in education, as in other industries, protecting education from competition can only harm students. 

The fastest way to improve outcomes for New Hampshire students is to give them more options. This can be done with a simple change. 

Eligibility for both the Tax Credit Scholarship and the Education Freedom Account programs is capped at 300% of federal poverty level. Removing the income cap and making both programs universally accessible would stimulate innovation, and match more students with their best educational environment, more rapidly than any other reform. 

Were all students to become eligible for both programs, competition would quickly begin to work its magic. There is no faster, more effective way to improve outcomes for all students. 

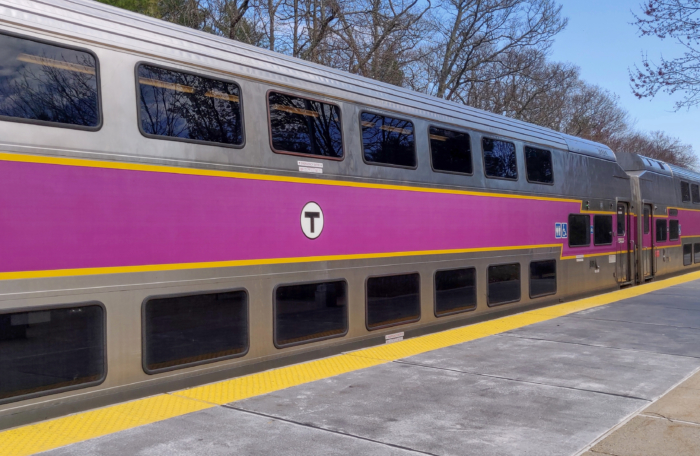
The January, 2023, draft of the state’s Capital Corridor commuter rail study contains nothing that commuter rail boosters should like. The financial analysis, prepared for the state Department of Transportation by AECOM Technical Services Inc. of Manchester, envisions a nearly $800 million railroad serving fewer than 100 Manchester commuters per trip, at an operating cost of $17 million per year. This represents a dramatic increase in costs and a devastating collapse in ridership since the DOT released its first Capital Corridor study in 2014. 

The report’s own dismal numbers show that Manchester-Boston commuter rail would squander hundreds of millions of dollars to serve only a few hundred riders per day, making it a colossal boondoggle. 

Failing its own goals

“The purpose of the Nashua-Manchester project (the Project) is to diversify mobility options that connect the southern New Hampshire region with the population, employment and commercial centers in the Greater Boston area, reduce congestion, emissions and travel time, and provide mobility options that promote equity and support demographic trends and preferences in the study area corridor,” the analysis states.

The report’s own numbers show that the Capital Corridor project would fail to achieve four of its five stated goals. 

  1. The Manchester ridership projections are so low (between 38-65 riders per trip by our favorable estimates) that the line will produce no noticeable impact on congestion.
  2. Low ridership numbers call into question whether the rail line will produce a worthwhile reduction in emissions. And the trains will be pulled by diesel engines that will begin operation just as auto manufacturers accelerate the switch to electric vehicles, which already account for 10% of auto sales. 
  3. The analysis projects that a trip from Manchester-Boston will take 1.5 hours by train. It currently takes one hour by car. Instead of reducing travel time, it will lengthen commute times by 50%. 
  4. Demographic trends and commuter preferences show that Boston-area employees would rather work from home or drive a car than commute into the city via mass transit. No data supports the creation of a new rail line to feed commuters into and out of Boston.

Rising costs, falling ridership

The 2023 draft financial analysis projects a total construction cost of $792 million. That is a 222.5% increase over the DOT’s original projection of $245.6 million in 2014. 

Adjusted for inflation (using the national Consumer Price Index), the original $245.6 million price tag would equal $312.9 million as of January, 2023 (the date stamped on the draft study). Yet the projected $792 million cost is 150% larger than that.   

The analysis projects annual operating and maintenance costs to be $17.27 million, a 60% increase from the 2014 projection of $10.8 million. Adjusted for inflation, the 2014 price tag would come to $13.76 million. The new projection is $3.51 million, or 25.5%, higher than that. 

As projected costs soar, projected ridership collapses. 

Both the 2014 and 2023 studies assume 16 commuter rail trips per weekday between a downtown Manchester station and Boston. The 2014 study projected a baseline average weekday ridership of 3,120 passengers on this line. That comes to 195 riders per trip.

The 2023 analysis does not project riders per weekday. Instead, it offers annual totals, which mask the collapse in projected daily ridership. 

The 2023 report projects an annual Manchester-Boston ridership of 271,538. That can be divided by 52 to get 5,221 riders per week. The report assumes some ridership on weekends, at a lower rate than weekdays, but it doesn’t break down the averages by day. If we generously include all weekend riders as daily commuters (which inflates the daily commuter numbers) and simply divide the weekly ridership by five, we get a mere 1,044 riders per weekday. That’s a 66% drop from the 2014 projections. 

Since 2014, the baseline assumption for ridership has fallen by 66% while the cost of building the line has increased by 222.5% and the cost of operations and maintenance has risen by 60%. 

That 66% decline in ridership comes before the study attempts to account for the effects of COVID-19 and its aftermath.

The study offers a low, medium, and high COVID impact analysis. Using the same method as before to convert those numbers from annual to weekday riders, we get the following:

Low COVID impact daily ridership: 835

Medium COVID impact daily ridership: 824

High COVID impact daily ridership: 612

When COVID’s impact is factored into ridership projections, the $792 million rail line is projected to transport 612-1,044 riders per weekday between Manchester and Boston. That comes to an average of 38-65 riders per trip, at a cost of $17.27 million per year. 

The analysis includes ridership projections for a Manchester-Boston Regional Airport station and a Nashua station. Those projections are higher than its projections for a downtown Manchester station. But those figures still represent significant declines in ridership from 2014 projections, with one possible exception. The projected ridership at a South Nashua Station could be slightly higher than the 2014 projections for a hypothetical “minimum commuter rail” option in Nashua, depending on how many weekend riders the new study anticipates. As mentioned above, we had to lump weekend riders into the weekday calculations since the study used only annual totals. But the bottom line remains that the study’s own projections show huge declines in ridership under most scenarios, and all Manchester scenarios, including the 2014 report’s “Manchester Commuter Rail” option that featured 20 trips per day. 

Unusual revenue assumptions

In addition to astronomical costs, the 2023 draft report assumes that fares (and some advertising) will cover an astronomical share of operating and maintenance expenses.

“The primary long-term source of O&M funding is fare revenue,” the report states. “This is a relatively unusual situation,” the analysis concedes. It claims its numbers can be justified because trains will be based in Manchester, thus ending the practice of starting and ending each trip with an empty train emerging from or returning to Boston.

In the study’s “medium ridership scenario,” which serves as the basis for its revenue projections, fares cover 81.5% of operating and maintenance costs. Its low COVID impact scenario assumes that fares would cover 93.4 percent of O&M costs. Its high COVID impact scenario assumes fares would cover 58.4% of costs. 

To get a sense of how realistic these figures might be, one can look at MBTA commuter rail revenues and expenses. In fiscal year 2019, the last year before the COVID pandemic, operating revenue covered 43% of MBTA commuter rail operating expenses, according to the MBTA’s audited financial report. In fiscal year 2022, revenues covered just 14% of MBTA commuter rail operating expenses, according to that year’s audited financial report. 

Such large declines in fare revenues and ridership have occurred nationwide. In San Francisco, fares covered roughly 2/3 of Bay Area Rapid Transit’s operating expenses for the 2019 fiscal year. By the 2021 fiscal year, fares covered just 12% of operating expenses, The Wall Street Journal reported last week.

In January, Mass Transit Magazine reported that “commuter ridership is disappearing.”

“Transit ridership across the U.S. has been sitting steadily at about 65 percent to 70 percent of pre-pandemic ridership across transit networks, according to data from the Transit App. This is an improvement from a year ago, when ridership hovered around 55 percent of pre-pandemic ridership.

“These sorts of headwinds, driven by significant changes in the way workers and others move around urban areas, will prompt transit agencies to rethink service delivery and other aspects of their operations, say experts.”

The DOT’s 2023 financial analysis assumes that fares will cover nearly all the operating costs of the Lowell-Manchester line even as subsidies cover nearly all of the MBTA’s existing commuter rail operating costs post-COVID.

MBTA commuter rail costs rose by 5.8% from 2019-2222 while operating revenue decreased by 66%, agency audits show. This has led to a rethinking of the MBTA’s offerings.

“We’re going to have to figure out a way to operate with lower fare revenue, and it remains to be seen how much lower it’s going to be,” MBTA General Manager Steve Poftak told The Wall Street Journal last March.

The state’s projected operating subsidy totals $25.2 million during the first three years of operation, as ridership is scaled up. After that, it is projected to settle at $200,000 per year. But if fare revenue doesn’t materialize as planned, the state subsidy would remain high, potentially consuming millions of dollars per year. This backup state subsidy ultimately makes state taxpayers the default financier of the rail line’s ongoing operations. If ticket revenues don’t materialize, the state would be stuck either covering those losses or ending service. 

Local station costs

“The financial analysis assumes that the cities of Manchester and Nashua fund the construction, O&M, and renewal costs of their respective downtown stations,” the report states.

It anticipates construction of a Manchester station at an estimated $51 million, including financing costs, and a Nashua station at an estimated $31 million, including financing costs. 

It assumes that Manchester will use meals & rooms tax revenue and Nashua will use local property tax revenue to pay for most of the construction. If taxpayers and elected officials refuse, then what? 

The report states that the Manchester-Boston Regional Airport would pay to build the proposed airport station. It does not explain how Nashua’s second station would be funded. 

Population density

Any study of commuter rail viability should start with population density. It’s considered a rule of thumb that a city needs a core population density near 10,000 people per square mile to make commuter rail successful. Yet nowhere does the financial analysis mention population density, on which a rail system’s financial viability depends.

That’s a serious omission. As we’ve noted before, Boston has a population density of 13,967.7 people per square mile, and Lowell ’s density is 8,489.8 per square mile. Manchester’s density is just 3,496 people per square mile. It doesn’t have a single zip code with a density of even 4,000 per square mile. Nashua’s density is just 2,961.7 per square mile. 

U.S. Census data put Manchester’s population density at 3,310 per square mile in 2010. In the decade from 2010-2020, the city’s density grew by just 186 people per square mile. At that rate, Manchester will reach 10,000 people per square mile in 350 years. If the city’s growth rate somehow doubled, it would still take 125 years to get to 10,000 people per square mile.

The report makes no effort to explain how a commuter rail line could be viable over the long term while serving such low-density cities as Nashua and Manchester.

Shifting work-life patterns

In addition to the density issue, there are numerous questions regarding the suitability of building a commuter rail line from a sparsely populated state into a shrinking city at a time when technology is changing the way we work. 

Suffolk County, Mass., which includes Boston, lost 28,000 people from 2020-2022, Census data show. Boston commercial vacancies early this year hit their highest rates in a decade, as demand for office space fell.

Several studies of Boston and Massachusetts commuters and employers (see here and here) have found significant declines in both mass transit use and the desire to commute via mass transit to offices in Boston. 

Most people want to work from home at least part of the week. People are fleeing many large cities, including Boston, in search of a more suburban lifestyle. Transit agencies around the country are factoring these shifting preference into their future plans. If these shifts represent a permanent change in American work and commuting patterns, as polls and changing behaviors suggest, now would be a particularly bad time to build a new point-to-point commuter rail line. 

Opportunity costs

The 2023 study proposes that the state would cover between $147.6 million and $185.4 million of the anticipated construction costs. If spent on commuter rail, that money could not be used for other state transportation priorities, of which there is no shortage. 

For comparison, Exit 4a in Londonderry is projected to cost $61.6 million to build, and the benefits are concentrated entirely in New Hampshire. This exit on I-93 is expected to boost economic development in Derry and Londonderry, reduce congestion and improve safety on local roads. The state could finance almost three projects of this scale for the high-end cost of the Capital Corridor rail line. And the benefits would be spread among a large share of  New Hampshire’s population, rather than split among employers in Manchester, Nashua and Boston.

The state’s current 10-year Transportation Plan dedicates $151.49 million to bridges this year. Bridge repair costs over the next decade exceed $900 million. When that level of need exists, it’s hard to justify spending more than a year’s worth of bridge repairs on a new rail line that would serve few people.

If the state were to create a list of the best possible ways to spend $185 million in transportation dollars, a rail line for the dwindling percentage of people who want to commute daily between Manchester and Boston would not make the top ten. The state has much higher transportation priorities.

Conclusion

The DOT’s own analysis shows that there is no scenario in which building a $792 million commuter rail line in the near future makes financial sense for New Hampshire. Construction and operating costs are rising much faster than inflation, while projected ridership is collapsing. Commuter rail does not extend from Lowell, Mass., into New Hampshire for good reason. It’s too costly and would serve too few people. This draft study confirms that.

Download a pdf copy of this policy brief; DOT Capital Corridor 2023 Brief

Editor’s note: Some of the percentage increase figures in the initial post contained typos. They have been fixed.

As legislators consider more proposals to expand Medicaid eligibility or services to specific populations, they ought to consider that Medicaid is both like and unlike the universe.

Like the universe, Medicaid is expanding faster than it should be. Unlike the universe, there’s no scientific possibility of Medicaid expanding forever. (Maybe the universe can’t either.)

Two bills moving through the Legislature this session are based on increasingly questionable assumptions about federal spending commitments. House Bill 282 would end the five-year waiting period for Medicaid eligibility for “lawfully residing” children and pregnant immigrants. House Bill 565 would extend Medicaid benefits for new mothers from two months after birth to a full year. 

These expansions come as New Hampshire enjoys a temporary, pandemic-related increase in its Federal Medical Assistance Percentage (FMAP), which is the share of Medicaid spending the federal government covers. For the duration of the federally declared COVID-19 emergency, 56.2% of New Hampshire Medicaid spending is covered by the federal government. When the emergency declaration ends on May 11, New Hampshire’s FMAP rate reverts to its normal level of 50%. 

(Incidentally, the additional 6.2 percentage points of additional federal funding during the pandemic emergency was given on the condition that the state not conduct eligibility determinations. That waiver of eligibility requirements will end when the emergency ends, which will affect an estimated 72,500 current enrollees. The pandemic enrollment increase has been so costly to the state that it has pumped additional federal funds into the Medicaid program.)

Legislators tend to assume that the default 50% rate will continue indefinitely. But the federal budget situation could prompt reductions in the federal contribution, something the Congressional Budget Office (CBO) recently suggested. 

The CBO this month projected that the federal deficit will nearly double from $1.4 trillion to $2.7 trillion in the next decade, and the federal debt held by the public would reach a record 118% of Gross Domestic Product. 

This record debt is driven by historically high federal spending, which is projected to increase from 23.7% of GDP to 24.9% of GDP by 2033. Federal spending has exceeded 24% of GDP only during World War II, the 2008 financial crisis, and the COVID pandemic. The CBO projects it to reach this level again within the next decade simply due to regular budget outlays. 

Federal revenues, meanwhile, are projected to remain around 18% of GDP through 2033. 

That unsustainable course will put pressure on Congress to cut costs or raise taxes or both. Anticipating this, the CBO in December offered suggestions for reducing the federal deficit. In the area of health care spending, the CBO suggested that Congress “establish caps on federal spending for Medicaid” and “reduce federal Medicaid matching rates.” 

Such actions are not out of the question. As the Congressional Research Service puts it, “Medicaid was designed to provide coverage to groups with a wide range of health care needs that historically were excluded from the private health insurance market.” But the program has grown over the years to cover people who could find coverage in the private market. 

By routinely expanding Medicaid benefits and eligibility, lawmakers have grown the program’s outlays from $206.2 billion at the turn of this century to $748 billion in federal fiscal year 2021. Medicaid accounts for 17% of U.S. health care expenditures. 

These expansions are unsustainable for both the state and federal governments. Eventually, some level of financial discipline, however small or limited, will have to be imposed. Clawing back Medicaid spending is politically easier than touching Social Security or Medicare. That is especially true after Medicaid has grown to cover people who could find alternative insurance coverage. Given those realities, current levels of federal Medicaid spending cannot be taken for granted.

Any discussion of expanding Medicaid coverage or eligibility should start with the understanding that current spending levels are unsustainable, and increasing those levels just accelerates the date of reckoning.

In the midst of an acute labor shortage that has pushed wages to new highs, a few legislators have opted to introduce another bill to raise New Hampshire’s minimum wage. 

House Bill 57 would raise the minimum wage to $15 an hour by 2025, then tie it to the inflation rate, ensuring regular, automatic increases. 

New Hampshire has about 48,000 job openings, according to U.S. Bureau of Labor Statistics data, and only about 20,000 unemployed persons. 

This imbalance between job openings and available labor has persisted for years. And that has driven wages in New Hampshire higher. New Hampshire Employment Security put the mean average wage at $30.12 an hour in last year’s report (based on 2021 data). In 2019, it was $25.94. 

The average entry-level wage in the 2022 report was $14.36, up from $11.80 in 2019. 

Competitive pressure is pushing wages up to the point that dishwashers have moved out of the list of the 10 lowest-paid occupations in the state. The lowest average wage in the 2022 report belonged to gambling dealers, at $11.59 an hour. Food preparation workers were above that at $12,10 an hour. 

With a booming economy and a severe labor shortage combining to raise wages naturally, the market is already moving compensation in low-paying occupations toward the $15 an hour goal. House Bill 57 would mandate a $13.50 minimum wage by this September. Fast food restaurants regularly advertise jobs well above that rate now, and food prep workers on average are quickly approaching that level. 

Into this discussion, researchers last month dropped yet another study showing that minimum wage increases have costs that can make people who work in the lowest-paid occupations worse off. 

Researchers at the John Hopkins Bloomberg School of Public Health and the University of Minnesota-Twin Cities School of Public Health found that minimum wage increases reduced the number of employers who offered health insurance. 

“We find that a $1 increase in minimum wages is associated with a 0.90 percentage point (p.p.) decrease in the percentage of employers offering health insurance, largely driven by small employers and employers with more low-wage employees. A $1 increase is also associated with a 1.80 p.p. increase in the prevalence of plans with a deductible and three percent increase in average deductibles.”

Though minimum wage hikes led to reductions in employer-sponsored health insurance, they did not lead to increases in uninsured rates, the authors found. That is “likely explained by an increase in Medicaid enrollment,” they wrote.

This study comes on top of decades’ worth of research that, on the whole, tends to find a negative effect on employment — particularly for younger workers and those with less education — from minimum wage increases. 

The preponderance of research on minimum wage increases shows that government-mandated compensation increases are not cost-free. Forcing employers to raise wages in ways that are unrelated to productivity tends to result in shifting resources from other parts of the business. That can include eliminating hours, positions or benefits.

Advocates for high minimum wages seem to assume that employers, including small businesses, simply have troves of cash reserves lying around and pay what they do out of stinginess. But employers generally aren’t sitting on piles of treasure like Smaug in his cave under Lonely Mountain.

And employers can’t simply manufacture more money whenever they want to spend more. Only the government can do that. Employers have to make trade-offs. If the government makes them pay more for low-skilled labor, they’ll take that money from somewhere else. And the results won’t necessarily be net positive for the low-skilled workers legislators intended to help. Usually, the opposite is true. 

In 2019, the state created a Housing Appeals Board to offer a speedier resolution to land use disputes between property owners and local boards. Though the cases that have gone to the board have been resolved quickly, a large backlog of cases remains in Superior Court.

Richard Head, government relations coordinator for the state judicial branch, told the House Judiciary Committee last month that the volume of land use cases in state courts has not noticeably changed since the Housing Appeals Board began operations in 2020. It turns out that there are so many legal challenges to local land use decisions that the state Superior Court has a constant load of between 60-100 cases at any given time, according to the judicial branch.

It can take more than a year for a landowner or developer just to get a court hearing if a local board improperly denies a building permit. It can take up to three years before the courts reach a decision, developers say. That long wait gives local regulatory bodies an upper hand in these disputes. 

The legal playing field should not be tilted in favor of government. Private citizens, whether homeowners challenging the rejection of a garage or developers challenging the denial of a commercial project, should have quick and ready access to the court system when they suspect a local board of illegally denying them the use of their property. (Local governments deserve the same if they suspect a developer of violating local ordinances.)

Within the court system, there are two obstacles. One, there aren’t enough Superior Court judges. The judicial branch is 3.5 judges short of being able to keep up with its existing caseload, according to its own presentations to legislators. Two, land use cases tend to be large and highly complex, which slows them down. 

New Hampshire has more than 200 unique zoning codes, many of them exceeding 100 pages, according to testimony by state Rep. Ben Ming, D-Hollis, an attorney who practices real estate law. 

The judges who hear these cases say the parties would be better served if a single judge could be assigned to hear all land use cases. 

“When asked, the judges in our Superior Court described these types of cases as complex,” Head told the House Judiciary Committee in January. The judges “require a great deal of time to get up to speed” when they receive one of these cases. 

“And one of the things the judges commented on was if we only see these as part of our regular docket and mixed in and occasionally, it is just a greater lift to get up to speed again and to get refamiliarize yourself not only with the case itself but with the technical aspects of it and the law, which is also, as you’ve heard, very complicated, long, and detailed,” Head said. “So to be able to consolidate these types of cases, the complexity of these cases, into a single docket would just have inherent benefits associated with doing so.”

Head’s explanation came in his testimony in January for House Bill 347, which would create a land use docket in the state Superior Court and fund the hiring of an additional justice to hear those cases. Importantly, the bill covers all local land use regulations, not just housing, so commercial and industrial property would be included. The state has a shortage of industrial buildings too, though it’s not as well known or as severe as the housing shortage. 

Creating a land use docket would accomplish five goals:

  1. Create within the judicial branch a level of expertise on these complex cases that would benefit all parties — the local boards, the property owners, and the justice who handles the cases;
  1. Reduce the long backlog of land use appeals that delay projects and discourage wronged parties from going to court;
  1. Create a level of consistency and continuity on complex land use cases that local boards and property owners could use to guide their future decision-making;
  1. Reduce backlogs of other civil cases, as the complex land use cases go to a newly hired judge;
  1. Generate economic benefits by reducing the amount of time and money local boards, property owners and developers spend in court, freeing them to spend more time concentrating on their core activities. 

Adding a land use docket to the Superior Court, and hiring a justice to handle the cases, will not solve the state’s housing and industrial real estate shortages. Better local land use regulations are the answer. But a separate court docket would greatly improve the dispute resolution process, level the playing field, and have the additional benefit of speeding up court cases in general and reducing the costs for property owners, developers and local governments.